J.M. Hidalgo et al. / Journal of Molecular Catalysis A: Chemical 420 (2016) 178–189
181
All Raman spectra were measured under dehydrated condi-
tions. The dehydration and oxidation protocol was the same as for
DR UV–vis spectra measurement (see above). The Raman spectra
were measured in glass cuvette by Nicolet DXR Smart Raman spec-
trometer equipped with CCD detection. Spectra were excited by
Smart Excitation Laser (Thermo Scientific) with laser wavelength
at 780 nm. The spectra were recorded by collecting of 2000 scans
using standard reference compounds along with GC–MS analyses
using Thermo Scientific ITQ 1100 unit.
3. Results and discussion
3.1. Characterization
(
scan time was 2 s with resolution 2 cm-1 in all cases). The laser
3.1.1. XRF, XRD and nitrogen physisorption
power delivered to the sample varied depending on the sample
concentration (max 50 mW). Spectrograph aperture was 50 m slit
The elemental composition of the supports and supported
vanadium catalysts obtained by XRF is presented in Table 1 and
Table 2, respectively together with their BET areas determined by
(
equivalent to laser spot size approximately 3.1 m at the sample).
The reducibility of the vanadium species in the vanadium-
physisorption of N . All supports were pure with minimum content
2
containing catalysts was determined by H -TPR using an AutoChem
of admixtures − SiO in Al O and Al O in TiO . The Mg/Al atomic
2
2
2
3
2
3
2
2
920 (Micromeritics) instrument. 100 mg of sample (50 mg for
ratio of the prepared HTC was 2.1:1. The BET area was similar for all
2
V/SBA-15) in a quartz U-tube were oxidized in oxygen flow at
supports (approx. 160 m /g) with exception of SBA-15 that exhib-
◦
4
50 C (2 h) prior to the measurement. Reduction was carried out
ited a large surface area due to its ordered mesoporous structure
(Table 1).
◦
◦
at T = 25–900 C with a temperature ramp of 10 C/minute under
reducing gas flow (5 vol.% H2 in Ar). The changes of hydrogen con-
centration were monitored by a TCD detector.
All of the vanadium-doped catalyst samples except V/HTC con-
tained approximately the desired amount of vanadium pentoxide
(8 ± 0.5%wt.). The vanadium content in the V/HTC sample was sig-
nificantly larger than the desired one because hydrotalcite was
dehydrated during calcination of impregnated sample resulting in
a significant weight loss of support (approximately 50%wt.). The
Acid-base properties of materials were characterized by means
of CO2 and NH3 temperature programmed desorption (TPD) using
Autochem 2920 (Micromeritics, USA). Typically 100 mg of sample
◦
in a quartz U-tube reactor was pretreated in He to 500 C with tem-
◦
perature ramp of 10 C/min. In the case of NH -TPD, the sample
specific surface area (SSA) of V/Al O3 was the same as of the sup-
3
2
◦
was cooled to 180 C and then it was saturated with ammonia by
port, whereas the other catalysts exhibited drop in the SSA in the
flow of 25 ml/min of 10 vol.% NH /He for 30 min. Subsequently,
range from 30 (for V/HTC) to 66 rel.% (for V/TiO ) relative to their
3
2
the gas was changed to helium (25 ml/min) in order to removed
physically/weakly adsorbed ammonia and flushing out until the
baseline was constant (60 min). After this procedure the tempera-
parent supports. Some changes in the SSA are very frequent for sup-
ported catalyst, especially in the case of porous materials, due to
the partial blocking of the pores, occupation of part of the space in
the pores by host species or partial changes in morphology of the
particles during impregnation and subsequent calcination.
◦
◦
ture was increased to 500 C with a rate of 15 C/min to obtain the
NH -TPD curves. In the case of CO -TPD, the sample pretreatment
3
2
was the same as in the case of NH -TPD. After the pretreatment
the sample was cooled to 50 C and the gas was switched to gas
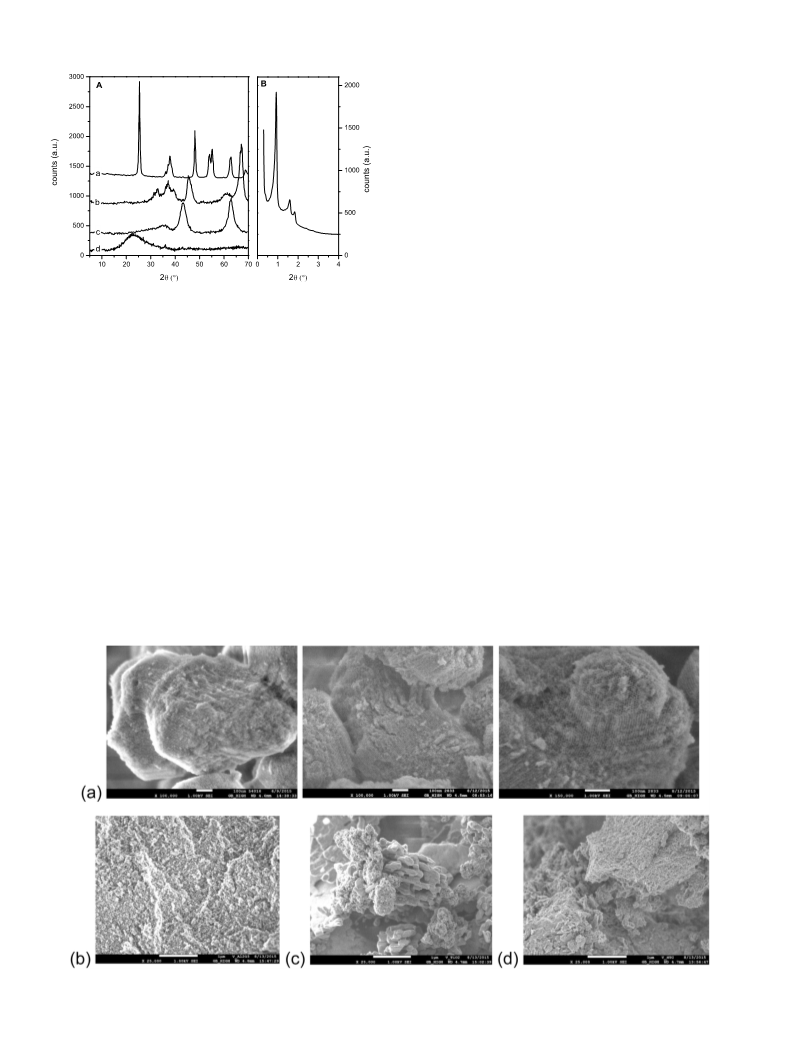
The XRD patterns of the catalysts are shown in Fig. 1. All of
the samples show peaks attributable to the oxidic supports and no
crystalline phases of vanadium oxides were observed. V/TiO2 (see
pattern a in Fig. 1A) exhibitstypical set of diffractions for anatase
phase (at two theta 25.3, 37.05, 37.9, 38.7, 48.16, 54.05, 55.2, 62.9
3
◦
mixture of 10 vol.% CO /He (25 ml/min). The sample was saturated
2
by CO2 for 30 min. After that the gas was changed to helium and
◦
left for another one hour at 50 C in flow of helium in order to
◦
remove weakly adsorbed molecules. TPD curves were obtained by
and 68.98 ) and no diffraction lines for rutile can be seen (Fig. 1A
◦
◦
increasing the temperature from 50 C to 500 C with the ramp of
pattern a). V/Al O3 catalyst exhibits relatively broad diffraction
2
◦
◦
1
5 C/min.
lines at 19.6, 32.2, 36.7, 39.5, 45.5, 61.4 and 67.25 attributable
to gamma alumina (Fig. 1A pattern b). XRD pattern of V/HTC con-
◦
sists of two broad peaks at 43.1 and 62.9 typical for MgO (Fig. 1A
◦
pattern c). Low-intensity broad feature between 30 and 40 have
2
.3. Catalytic tests
been previously attributed to partially crystalized Mg orthovana-
date. [34,35] V/SBA-15 catalyst exhibits only a very broad band
between 15 and 30 which belongs to amorphous silica (see Fig. 1A
◦
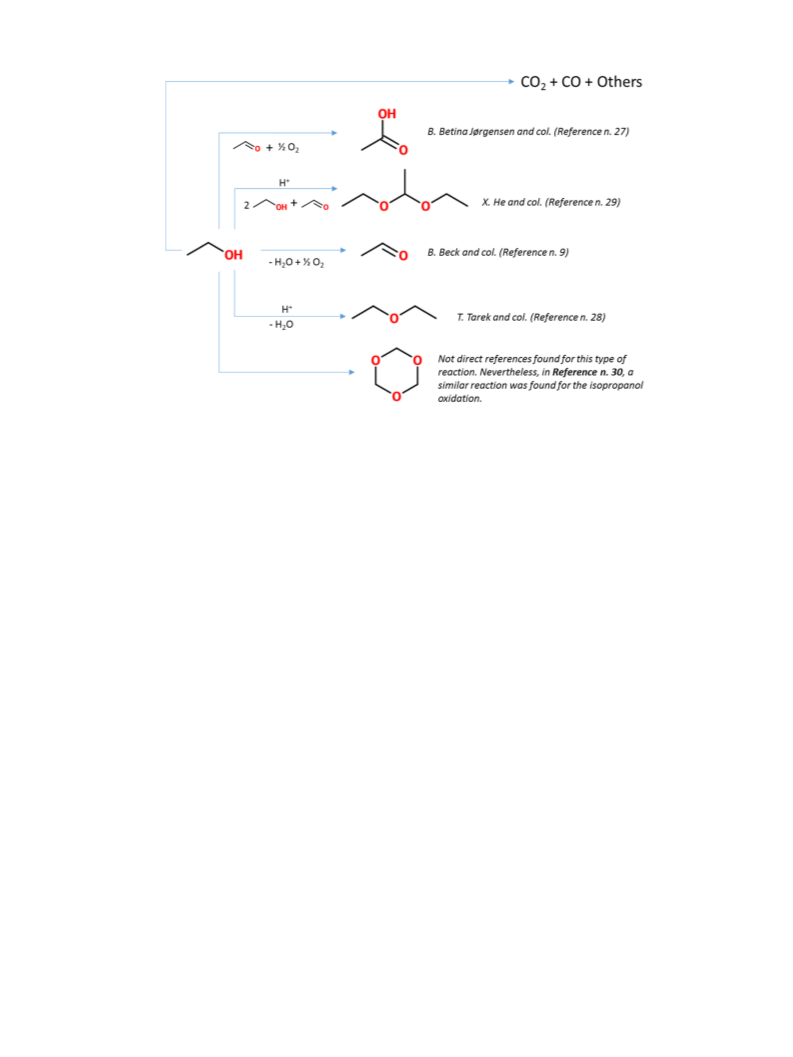
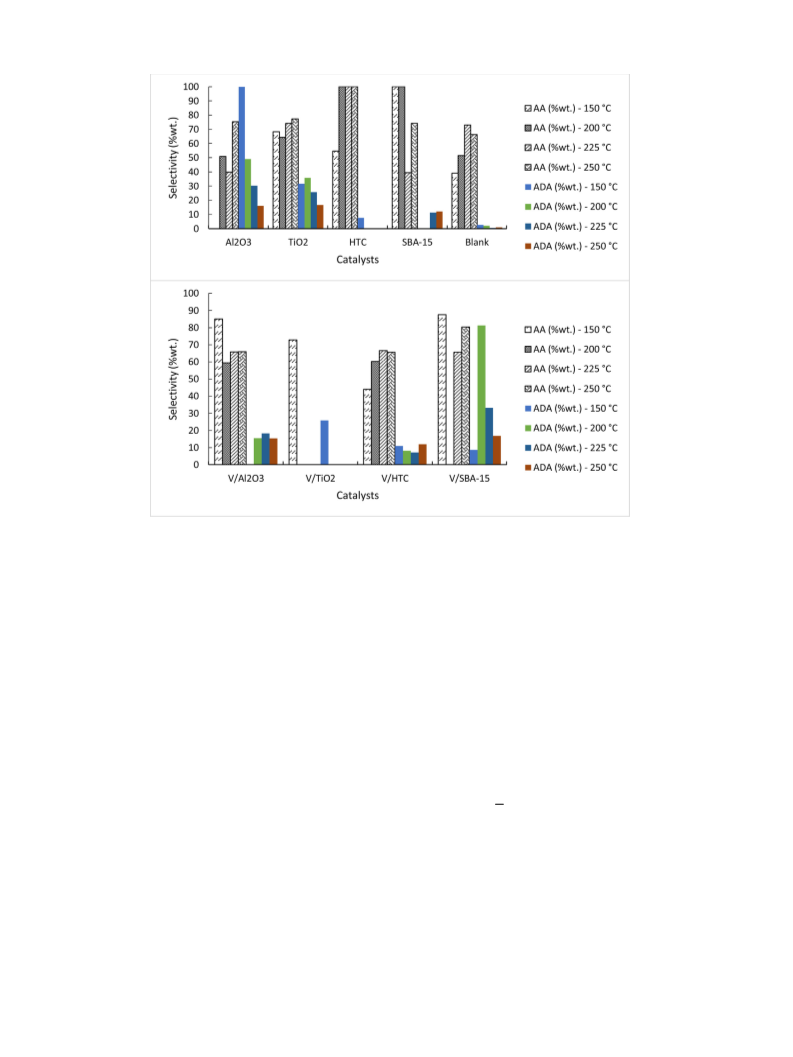
All the catalysts were tested with the aim to determine their
activity and selectivity in the oxidation (oxidative dehydrogena-
tion, ODH) of ethanol. A trickle bed reactor (stainless steel 316)
with a length of 1000 mm was used. The reaction was carried out
using 2.2 g of catalyst. The catalyst was prepared in a form of pel-
lets with a diameter of 0.5 mm. The catalyst bed had a length of
pattern d). Small angle XRD pattern of V/SBA-5 (Fig. 1B) exhibited
three peaks at 0.919, 1.593 and 1.836 that can be indexed on a 2-D
hexagonal lattice.
3.1.2. SEM
3
01 mm and was located in the central part of the reactor. The cat-
alyst and silicon carbide (0.5 mm particles) were mixed thoroughly
20 ml SiC + 2.2 g of catalyst) and loaded into the reactor. Finally, the
SEM images of V/SBA-15 show lenticular particles of approx.
0.5 m in diameter with an ordered porous structure typical of a
(
SBA-15 material (Fig. 2(a)). For V/Al O3 and V/HTC, the presence
2
remaining free volume of the reactor was filled with silicon carbide.
Air flow, used for the catalytic reaction, was fed directly (activation
of very small particles clustered to agglomerates is visible in the
images (Fig. 2(b) and (c)). For the TiO structure, two types of appar-
2
◦
◦
1
h at 400 C; 5 C/min from room temp.) or mixed with feedstock
ent structures were identified; the elongated structure could be
assigned to ordered TiO2 and the “sponge-like” form to the amor-
phous titanium oxide formed in suspense during the impregnation
of vanadium on the surface. No separate particles of vanadium
oxide were observed in any of the catalysts.
before entering the reactor. All catalysts were tested at 150, 200,
◦
2
25 and 250 C using 5 NL/h air flow, 1 bar of pressure and 5 g/h of
ethanol. V/TiO2 catalyst was also tested using larger times of reac-
tion. The products were collected in two collectors, the first one
cooled by water to room temperature and the second one cooled to
◦
0
C. Each two collected liquid samples were mixed to one sample
3.1.3. UV–vis and raman studies
and analysed using a GC-FID “Agilent 7890A” and GC-OFID “Agilent-
Wasson-ECE Instrumentation”. Gaseous products were analysed by
the method “Refinery Gas Analysis” RGA (Agilent Technologies)
with a GC 7890A Agilent (USA). The products were identified by
UV-vis spectra of the dehydrated catalysts are presented in
Fig. 3. All catalysts exhibit several absorption bands in the region
2–6 eV which are conventionally attributed to the ligand to metal
charge-transfer transition of the O→ V type. It must be noted that
V

 Hidalgo