PECULIARITIES OF AZOBENZENE CATALYTIC HYDROGENATION
33
were measured volumometrically, and the concentraꢀ
3
n 10 , mol
×
tions of initial compounds and reaction products, 2.8
aniline and 1,4ꢀphenylenediamine, were controlled by
gasꢀliquid and liquid chromatography. The analysis of
2.4
4AAB and products of its reduction was performed on
an LKhMꢀ80.6 chromatograph with packed columns
and a flameꢀionization detector. Chromaton NꢀAW,
2
.0
4
00–600
7 wt %), was used as the solid phase; the length of a 1.6
column was 1.5 m; the inert carrier gas was He; tcol
78°С tvap = 320°С tdet = 240°С; and pHe = 2.50 atm.
µ
m fraction covered with Lukopren Gꢀ1000
(
=
nAB
1
;
;
1.2
Our analysis of AB and its reduction products colꢀ
lected at different reaction times was performed on a
Shimadzu liquid chromatograph under the following
conditions: the carrier was an acetonitrile–water mixꢀ
ture with 30 vol % of acetonitrile; the rate of eluent in
nA
0
.8
.4
nH2
0
3
a column was 0.9 cm /min; the temperature of a colꢀ
umn thermostat was 30.8°С; and the wavelength of the
photometric detector was 322 nm. The time of aniline
0
50
100
150
200
250
300
τ, s
elution under these conditions was 330
time of azobenzene elution was 1410
sitivity of the analytic method was 10 mol in the
±
5
s, and the
±
30 s. The senꢀ
⎯
8
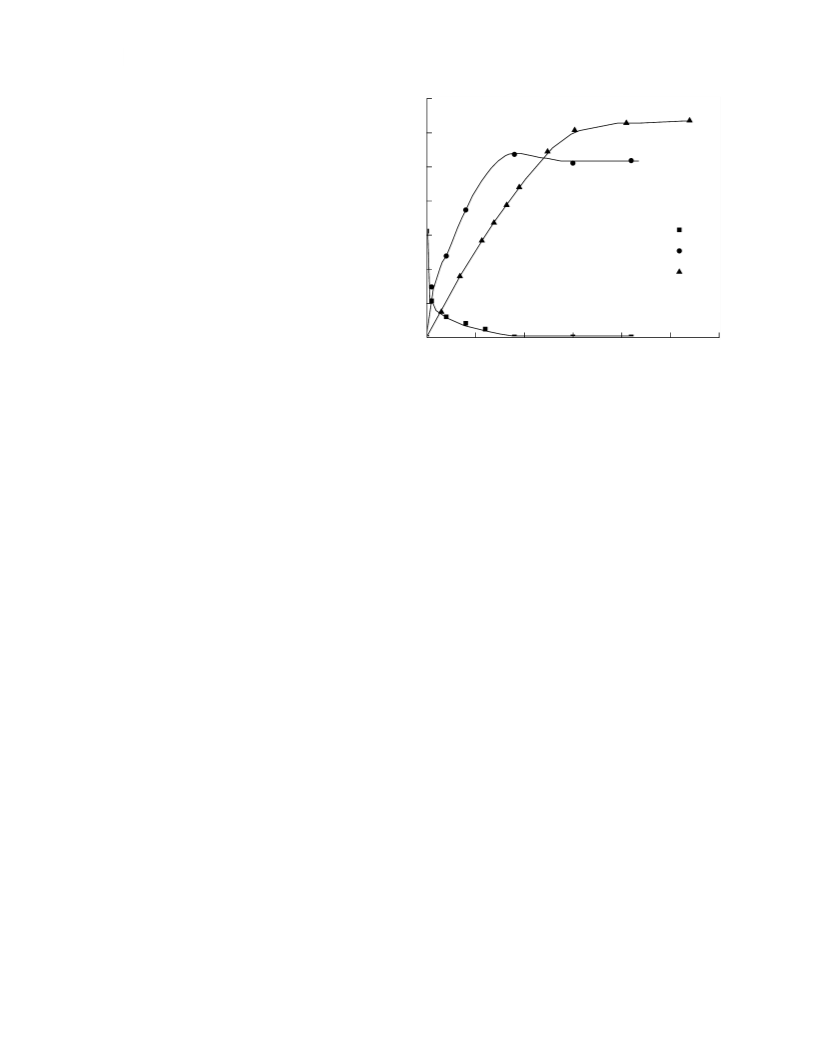
Fig. 1. Kinetic curves of the azobenzene hydrogenation
reaction over skeleton catalyst in 2ꢀpropanol aqueous soluꢀ
tion at the atmospheric pressure of hydrogen; х2 = 0.07,
reactor.
0
AB
mcat = 0.500
±
0.001 g, Texp = 303 K,
c
= (1.4
±
0.1)
×
0–5 (mol/l).
RESULTS AND DISCUSSION
1
It was shown experimentally that during AB and
AAB hydrogenation over skeleton nickel catalyst in
4
AB, and aniline in solution during the reaction time
are shown. As we can see from the presented data, the
amount of aniline formed at the beginning of the reacꢀ
tion exceeds the amount of hydrogen taken from the
gas phase. This indicates the participation in the reacꢀ
tion of hydrogen bonded by active centers of the cataꢀ
lyst surface. From the data shown in Figs. 1 and 2, it is
obvious that the aniline concentration in the volume
phase sharply increases at first, reaches a maximum,
and then declines. It is typical that the lower the
alcohol content in a solvent, the more quickly the
all of the solvents we used, the dependence of the rate
on the degree of reaction completion corresponded to
the kinetic curves of reactions that followed the direcꢀ
tion of hydrogenation [6]. In alkali, neutral, and acidic
solutions, the AB and 4AAB hydrogenation reaction
proceeded without the accumulation of intermediate
products in the reaction medium. In all solvents at
high and medium concentrations of azobenzenes,
areas with orders close to zero were observed on the
0
kinetic curves. The rate of hydrogen consumption,
r
,
H2
at degrees of conversion of the initial compounds of maximum is achieved. For example, for 2ꢀpropanol
less than 0.1 was chosen as the main kinetic characterꢀ aqueous solution with х2 = 0.07, the maximum posiꢀ
istic of azobenzenes reactivity.
tion corresponds to a time value of 75
upon transitioning to a solvent with х2 = 0.68 it rises
to 275 15 s.
After complete AB conversion, hydrogen conꢀ
sumption continues and corresponds perfectly to the
reaction stoichiometry upon completion of the reacꢀ
tion. The values for the initial reaction rates of hydroꢀ
genation and AB adsorption values in 2ꢀpropanol
aqueous solutions are shown in Table 1.
± 5 s, while
The observed values of rate constants of reaction,
±
0
k
, were also calculated in studying the 4AAB hydroꢀ
obs
genation reaction, with allowance for the solubility
and hydrogen partial pressures. The values of rate conꢀ
0
stants on an equally accessible surface, kS , were calcuꢀ
lated according to the method described in [2, 3, 7].
Statistical analysis of the results showed that the errors
0
H2
0
in the values of rates,
r
, and rate constants, kS , were
It follows from these data that an increase in the
8 and ~15%, respectively. The values of azobenzene water content in a solvent leads to an increase in both
~
adsorption were calculated according to the data from the AB hydrogenation rate and AB adsorption. It is
a chromatographic analysis of test portions collected known [8] that introducing acid or base additives into
during a reaction. In some cases, the activation enerꢀ a 2ꢀpropanol aqueous solution also effects the rates of
gies were calculated according to the data on reaction azobenzene hydrogenation.
constants or reaction rates at different temperatures.
The values for the initial rates of hydrogen conꢀ
In Figs. 1 and 2, the exemplary kinetic curves charꢀ sumption in AB and 4AAB hydrogenation reactions in
acterizing the change of amounts of hydrogen taken, 2ꢀpropanol aqueous solutions with the addition of
RUSSIAN JOURNAL OF PHYSICAL CHEMISTRY A
Vol. 86
No. 1 2012

 Lefedova