1
26
Y. Zhang et al. / Applied Catalysis A: General 408 (2011) 125–129
denoted as AlMg-1.5). Therefore, this material was confirmed to
be mixed phase of MgO and Al O3 with a higher crystalline.
2
In order to investigate the surface properties for the Al O /MgO
2
3
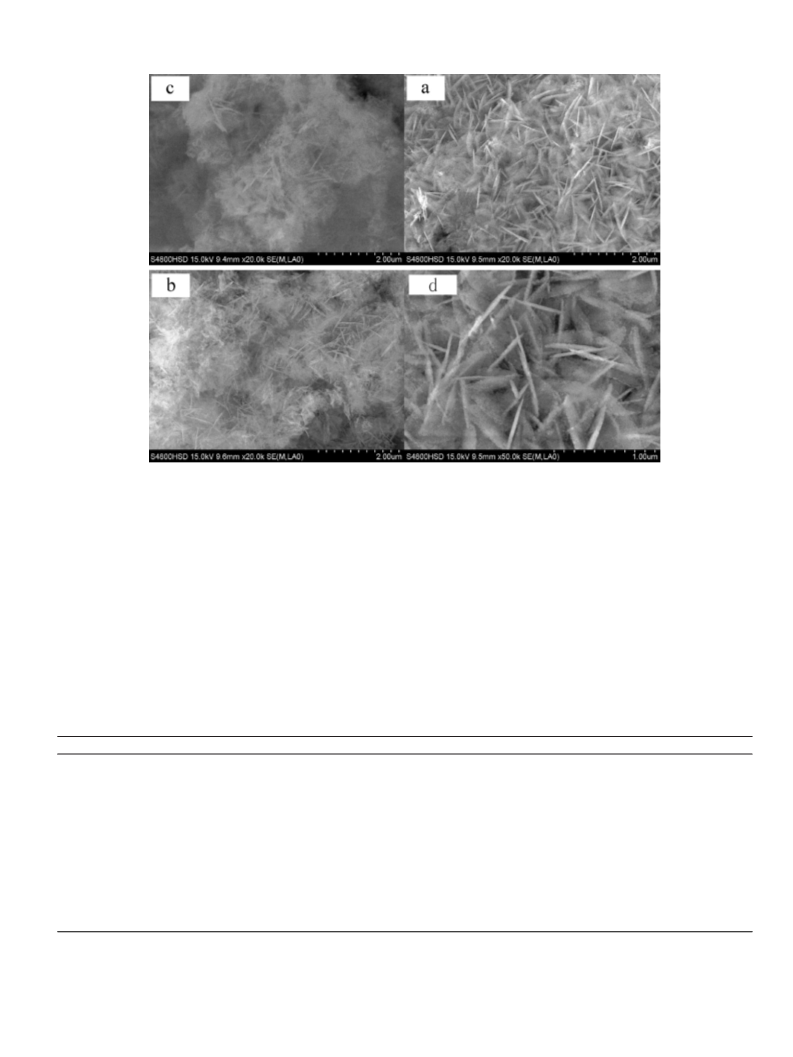
composite, the morphology of the composites with different cal-
cined temperatures was observed with SEM (Fig. 2). A mixture
of thin flat and needle-like crystals was formed. The size in nee-
dle width was less than 100 nm and it was uniformly dispersed as
shown in Fig. 2a and d, which is beneficial to its catalytic perfor-
mance for the addition reaction. With the increase in calcination
temperature the surface morphology was obviously changed. The
crystalline was reduced and the thin flat and needle crystals began
AlMg-1.5
◦
to aggregate at calcination temperature of 400 and 500 C (Fig. 2b
MgO
Al O
and c). As a result, the surface area of the composite AlMg-1.5 was
2
remarkably decreased from 84.6 to 66.7 m /g with increase in cal-
2
3
◦
cination temperature from 300 to 500 C. This dropped area may
cause the decline of the catalytic performance.
IR spectrum of AlMg-1.5 was recorded with pressed KBr pellet
30
40
50
60
70
80
90
100
110
120
−
1
2
Theta (deg)
in the 4000–400 cm region (Fig. 3). The high frequency region
−
1
showed a broad band at about 3431.0 cm
and a narrow band
Fig. 1. XRD pattern of Al2O3-MgO composite.
−1
at 3699.8 cm , which are likely assigned to hydrogen stretch-
ing mode of hydroxyl groups in M–OH or M–H O. Especially, the
2
◦
◦
solution was dried at 100 C, followed by calcined at 300 C for 4 h
to afford MgO (s1).
narrow band is attributed to stretching vibration of the isolated
surface OH groups. The vibration of the isolated OH groups on the
Al O /MgO composite was almost disappeared in the FT-IR spec-
MgO (s2) was synthesized through the same method for
Al O /MgO preparation. 10 g of MgO was charged into 10 mL water
in a three-neck flask. The mixture was stirred at 80 C for 1 h, and
then aged statically at the same temperature for 12 h, followed by
dried at 100 C for 12 h. Thereafter, the solid was calcined at 300 C
for 4 h in a furnace to afford MgO (s2).
2
3
◦
2
3
trum of the sample after being calcined at 500 C. Since the band
positions in the infrared spectrum are reciprocally related to the
bond strength of the cation to oxygen and the influence of divalent
and trivalent metal on hydroxyl group is very different, there-
fore, the broad and narrow band can be predominantly assigned
to stretching vibration of Mg–OH and Al–OH, respectively [12].
◦
◦
◦
−
1
2
.2. Catalyst characterization
The bands observed at 1636.9 and 1381.8 cm
are respectively
ascribed to bending vibration mode of these two groups. The shoul-
−
1
The XRD of the samples was performed on a Bruker-D8 Advance
der bands at 567.0 and 652.6 cm could be assigned to translation
modes of the hydroxyl groups mainly influenced by the trivalent
aluminum but probably influenced by Mg2+ in its coordination [12].
X-ray diffractometer with Cu K␣ radiation (40 kV and 36 mA). The
morphologies of the samples were observed by a Hitachi S-4800
scanning electron microscopy (SEM). FT-IR spectra of the sam-
ples were recorded on vertex 80 infrared spectrometer (Brucker
Company). The surface area of the catalyst was determined by N2
adsorption–desorption using NOVA 2000e surface area and pore
size analyzer. The elemental analysis of the Al O -MgO was made
−
1
Besides, the appearance of absorption band at 422.6 cm is char-
acteristic of lattice vibrations of Mg or Al octahedral (␦ O–M–O)
[5].
2
3
3.2. Catalytic performance
on ICP-MS (Angilent Company).
.3. Catalysis test
All the reactions were carried out in a sealed stainless-steel auto-
3
.2.1. Catalytic performances of various catalysts
Table 1 summarized the catalytic activities of various oxides and
2
their composites, such as MgO, CaO, ZnO, Al O , KCl-KOH-MgO,
CaO-ZnO, Al O -ZnO and Al O -MgO with different BET surface
2
3
2
3
2
3
◦
clave (500 mL) equipped with a mechanical stirrer and an electric
heater. In a typical procedure, 30.1 g (0.32 mol) of phenol, 30 mL
area for the reaction of PO with phenol at 120 C for 5 h. As can
be seen, MgO exhibited a good activity for the reaction, giving
84.4% conversion and 98.5% selectivity to 1-PhP (entry 1). The
synthesized MgO (s1) and MgO (s2) basically presented similar
catalytic performance to the purchased MgO (entries 2 and 3). KCl-
KOH-MgO showed nearly the same activity as MgO although it
possesses stronger basicity than MgO (entry 4). Conversely, CaO
and its composite CaO-ZnO represented very low activity for the
reaction, suggesting that the strong basicity is suppressive for the
reaction (entries 5 and 6). However, the oxides ZnO, Al O and their
(
0.5 mol) of propylene oxide and 1.5 g of catalyst were added into
the reactor. After purging for 5 min with N2 flow, the mixture was
heated to the desired temperature under stirring. After the reaction
was completed, the reaction mixture was cooled down to room
temperature and filtered to remove the catalyst. The liquid sam-
ples were analyzed by GC and GC-MS. The catalyst was washed
with ethanol, then dried and used for the next run. The conversion
and yield was calculated on the basis of phenol.
2
3
composite Al O -ZnO with approaching neutrality or weak acidity
2
3
3
. Results and discussion
exhibited lower activity (entries 7–9). It was known that few weak
basic sites were presented on Al O , while a large amount of mod-
2
3
3
.1. Catalyst characterization
erate basic sites were presented on MgO and strong basic sites on
CaO [4]. This implied that the moderate basic sites on the catalyst
surface played a key role for the reaction. Furthermore, the com-
Fig. 1 illustrates XRD patterns of Al O /MgO, MgO and Al O . As
2
3
2
3
compared with that of MgO and Al O , the composite material pre-
posite oxides Al O /MgO with different Al/Mg molar ratios were
2
3
2 3
pared from magnesium and aluminum salts is mainly composed of
MgO and Al O as shown in the figure and the characteristic diffrac-
found to have high activity and selectivity for the addition reaction.
The composite Al O /MgO with Al/Mg molar ratio 1.5%, denoted
as AlMg-1.5, exhibited highest activity (entry 10), but when the
Al/Mg molar ratio was above 1.5% the catalytic activity was slightly
2
3
2
3
◦
◦
tion peaks of Al O at 2Â = 48.9 and 55.2 were observed, although
2
3
there is a little content of Al in the composite (1.5% mol/mol,

 Zhang, Yongbo