A. Venugopal et al. / Applied Catalysis A: General 469 (2014) 398–409
399
steady-state activity was reached within 30 min. Nature and
activity of Zn–Cr–O was described in concurrence with dehydrocy-
clization activities in relation with product distribution and their
physicochemical characteristics particularly acid-base properties.
300 to 400 ◦C and atmospheric pressure in a fixed-bed vertical
quartz reactor (i.d = 8 mm, length = 450 mm) placed in a two zone
furnace operated in a down flow mode. The first zone was pre-
heating, which was maintained at 300 ◦C, and the second zone was
the catalyst bed temperature, both monitored by a temperature
controller-cum-programmer using a K-type thermocouple. Glyc-
erol (Fluka) and EDA supplied by SDFCL, India were used. Nitrogen
(IOLAR-I grade, BOC, India) was used as a carrier gas. The catalytic
activities were carried out using −18/+23 sieved (BSS) catalyst
particles. The carbon mass balance was done based on the inlet
and outlet concentration of the organic moiety. Prior to the reac-
tion, about 0.2 g of calcined catalyst (sieved particles −18/+25 BSS)
was reduced in 5% H2/Ar using 30 mL min−1 at 400 ◦C for 5 h. The
catalytic activities were measured under strict kinetic control. An
aqueous glycerol solution (20 wt% in H2O) was used with a glycerol
to EDA mole ratio of 1:1, at a flow rate of 5 mL h−1 (10 mmol glyc-
erol + 10 mmol EDA + 200 mmol H2O), along with N2 as the carrier
gas at a flow rate of 1800 mL h−1. The reaction mixture contained a
glycerol:EDA:H2O:N2 = 1:1:20:8 mole ratio. In some cases the flow
rates were maintained at 8, 12 and 15 mL h−1. In order to assess
the nature of surface acid-base sites on dehydrocyclization activity
of ZC450; pyridine (Bronsted and Lewis acid site blocker) and 2,6-
dimethylpyridine (selective Bronsted acid site blocker) were used
as probes. About 0.2 g of ZC450 sample was reduced in 5%H2/Ar at
400 ◦C/5 h followed by a dose of 500 mol of pyridine in 10 suc-
cessive pulses in a time interval of 10 min injected into the stream
using 30 mL min−1 of N2 as carrier gas at a temperature of 350 ◦C.
After the pyridine adsorption the sample was flushed with N2 at
350 ◦C for 1 h subsequently the reaction was carried out using a
reaction mixture that contained glycerol:EDA:H2O:N2 = 1:1:20:8
mole ratio and the liquid mixture (glycerol + EDA + H2O) flow rate
of 5 mL h−1. Similar protocol was maintained while using about
580 mol of 2,6-dimethylpyridine as another probe in 10 succes-
sive pulses in a time interval of 10 min injected into the stream. The
product mixture was analyzed by gas chromatograph (Shimadzu,
GC-17A) via a flame ionization detector (FID) using a ZB-5 capil-
lary column at a ramping rate of 10 ◦C min−1 from 60 to 280 ◦C.
The mass balance for all the measurements was >95%. The sam-
ples were analyzed by GC–MS (QP5050A Shimadzu) using a ZB-5
capillary column with EI mode (SI).
2. Experimental
2.1. Preparation of catalysts
The Zn–Cr–O catalyst employed in this investigation was pre-
pared by a simple co-precipitation method using Zn(NO3)2·6H2O
and Cr(NO3)3·9H2O (Sigma-Aldrich) with Zn:Cr = 2:1 (mole ratio),
in order to produce a hydrotalcite structure [2]. The sample was
prepared at a constant pH of 9 using a mixture of 2 M NaOH + 1 M
Na2CO3 (base mixture) as precipitating agent. The gel was washed
thoroughly, filtered and oven-dried for 12 h at 120 ◦C, and calcined
in static air at 400, 450, 550, 650 and 750 ◦C for 5 h. The calcined
Zn–Cr–O samples were denoted as ZC400, ZC450, ZC550, ZC650
and ZC750, respectively. The residual Na contents in the ZC400,
ZC450, ZC550, ZC650 and ZC750 samples were analyzed by AAS
and was found to be 0.33, 0.34, 0.30, 0.34 and 0.31 wt%, respectively.
All of these samples were then evaluated for dehydrocyclization of
EDA and aqueous glycerol and a selection of representative samples
were characterized by adsorption and spectroscopic techniques.
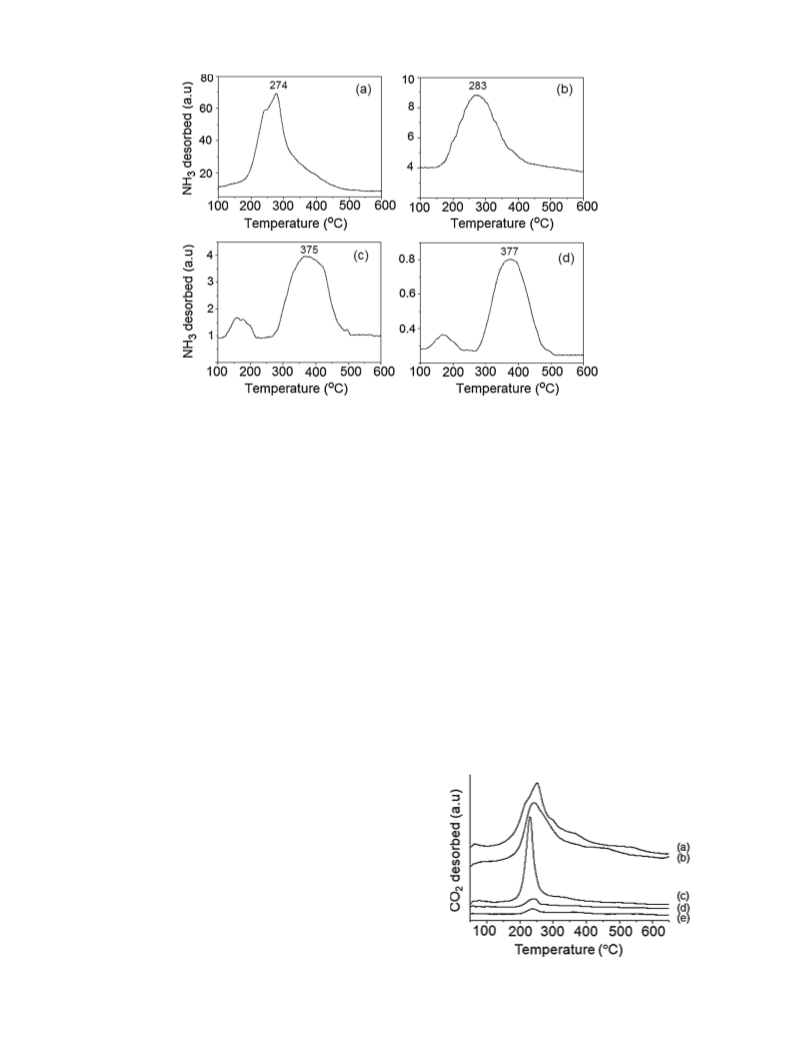
2.2. Characterization of catalysts
Experimental conditions for the measurement of BET surface
area, XRD, Raman, XPS, TPR, O2 pulse chemisorption and TPD of
NH3 analyses were similar as reported earlier [4]. The basicity
of catalysts was estimated by TPD of CO2 using an Auto Chem
2910 (Micromeritics, USA). In a typical method about 0.1 g of cal-
cined Zn–Cr–O sample was reduced at 400 ◦C for 5 h in 5%H2/Ar
(v/v) at a flow rate of 30 mL min−1. After reductive pre-treatment
the sample was saturated with 10.18% CO2 (balance helium) at
60 ◦C, at a flow rate of 50 mL min−1 and subsequently flushed with
helium gas at 60 ◦C for 1 h. The TPD CO2 measurements were car-
ried out from 60 to 600 ◦C at a ramping rate of 10 ◦C min−1. The
amount of desorbed CO2 was calculated using GRAMS/32 soft-
ware. The Fourier transformed infrared spectra were recorded in
KBr pellets using a Thermo Nicolet Nexus 670 spectrometer in the
region of 4000–400 cm−1. FT-IR spectra of air calcined at 450 ◦C/5 h
fresh; reduced (calcined in air at 450 ◦C/5 h followed by reductively
pre-treated in 5%H2/Ar at 400 ◦C/5 h), and the pyridine adsorbed
(calcined in air at 450 ◦C/5 h followed by reduction in 5%H2/Ar at
400 ◦C/5 h and subsequently a dose of approximately 500 mol
of pyridine injected in 10 successive pulses with each pulse of
40 L in N2 stream 30 mL min−1 on to catalyst at a temperature of
350 ◦C and flushed with N2 at 350 ◦C/1 h) and 2,6-dimethylpyridine
adsorbed (calcined in air at 450 ◦C/5 h followed by reduction in
5%H2/Ar at 400 ◦C/5 h and subsequently a dose of ∼580 mol of 2,6-
dimethylpyridine injected in 10 successive pulses with each pulse
of ∼60 L in N2 stream 30 mL min−1 on to catalyst at a temperature
of 350 ◦C and flushed with N2 at 350 ◦C/1 h) ZC450 sample. After
the required pretreatment and subsequent adsorption of the probe
molecule the samples were immediately transferred into desicca-
tors and the wafers were subjected to FT-IR analysis. The carbon
contents in used catalysts (recovered after 6 h of continuous oper-
ation) were measured using a VARIO EL, CHNS analyser. For brevity
the TPR pattern, TPD of NH3 curve, XPS and Raman spectra of ZC450
sample is not shown in this paper as we have reported it earlier [4].
3. Results
3.1. BET-surface area and XRD analysis
The BET-surface areas of Zn–Cr–O samples are reported in
Table 1. Surface area of the Zn–Cr–O sample drastically decreased
from 76.5 to 21.6 m2 g−1 with the increase in calcination tem-
perature from 400 to 750 ◦C. XRD patterns of the Zn–Cr–O oven
dried sample (SI) exhibited diffraction data characteristic of the
hydrotalcite structure and upon calcination in static air at vari-
ous temperatures ranged between 400 and 750 ◦C (Fig. 1) showed
reflections attributed to ZnO [ICDD no. 89-0510] and ZnCr2O4 [ICDD
no. 22-1107] phases [4–6]. Peaks due to neither ZnO nor ZnCr2O4
nature or the crystallite size below the X-ray detection limit. Gen-
eration of very fine ZnCr2O4 spinel increases the surface area by
ZnCr2O4 spinels leads to lowering of the surface area due to unsup-
pressed ZnO crystal growth [7]. The average crystallite size of ZnO
and ZnCr2O4 were measured using Scherrer formula and the data
is reported in Table 1. Fig. 1 shows an increase in resolution of
ZnO and ZnCr2O4 peaks and the crystallite size of ZnO and ZnCr2O4
phases at high calcination temperature. At low calcination temper-
atures ∼400 ◦C, formation of neither zinc chromite nor ZnO phases
2.3. Activity measurements
The dehydrocyclization activities on calcined and/or reduced
Zn–Cr–O catalysts were performed in the temperature range of

 Venugopal, Akula