G. Zhou et al. / Journal of Catalysis 311 (2014) 393–403
395
electron microscopy (TEM) on a JEOL JEM2011 microscope oper-
ated at 200 kV, which was coupled with an energy-dispersive
X-ray analyzer (EDX; Oxford INCA) for local elemental determina-
tion. The catalyst was dispersed in anhydrous ethanol, sonicated
for 10 min, and dropped onto a carbon film-coated copper grid.
Particle size distribution (PSD) histogram was constructed by ran-
domly measuring at least 300 NPs.
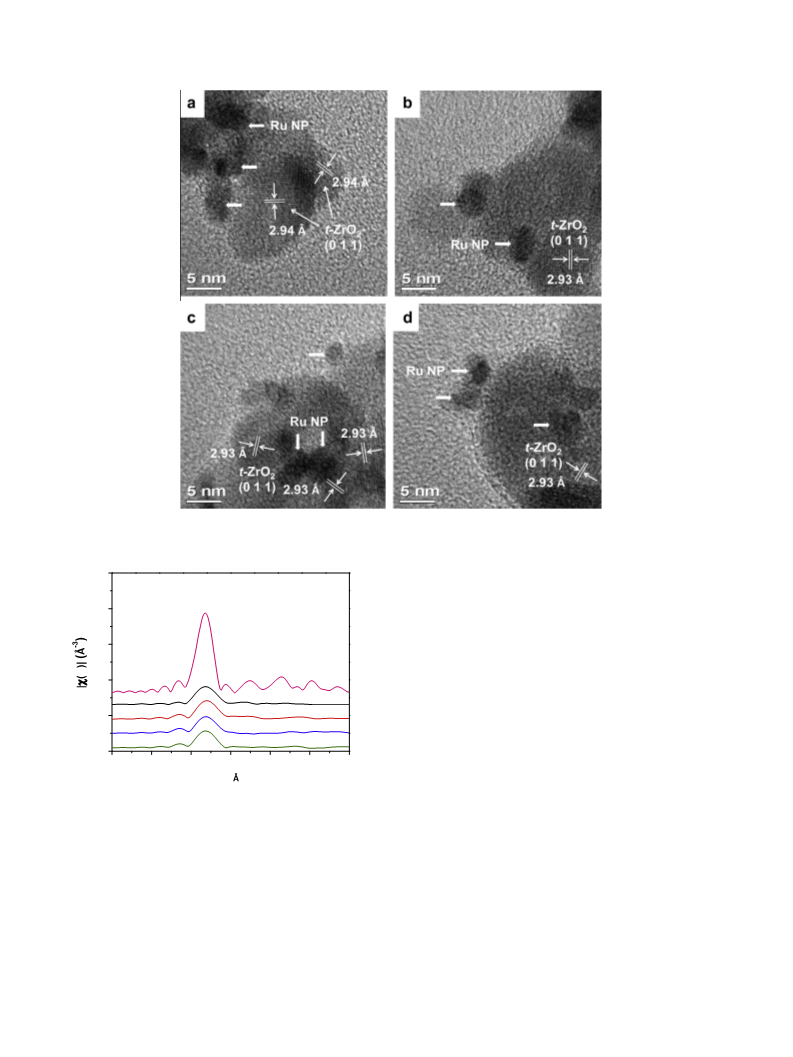
X-ray absorption spectrum at the Ru K-edge was acquired on
the BL14W1 beamline of the Shanghai Synchrotron Radiation
Facility (SSRF) in the fluorescence mode. The typical electron beam
energy was 3.5 GeV, and the current was 300 mA. The catalyst was
coated on the scotch tape, pressed into the Al window, and inserted
in the sample stage. X-ray absorption near-edge structure (XANES)
was compared after normalization. Extended X-ray absorption fine
structure (EXAFS) data were analyzed by the IFEFFIT analysis pack-
age following the standard procedures [25]. The background was
removed by extrapolating the pre-edge region onto the EXAFS re-
of benzene was carried out in a mechanically stirred 500 ml-capac-
ity stainless steel autoclave under conditions typical for this reac-
tion [22,29]. The autoclave was charged with 100 ml of deionized
water containing 1.0 g of the catalyst, 2.0 g of ZnSO4Á7H2O, 50 ml
of benzene, and then sealed and purged with H2 for four times to
expel air. It was proposed that water renders a stagnant water
layer surrounding the catalyst, resulting in the suppression of the
reaction rate and in a strong increase in the selectivity and yield
of cyclohexene [30]. ZnSO4Á7H2O is the most effective modifier in
improving the selectivity toward cyclohexene [31–33] among
abundant additives investigated such as NaOH [3], ethanolamine
[5], PEG-10000 [34], monoethanolamine [35], and monoethylene-
glycol [35]. For benzene partial hydrogenation to cyclohexene,
water and ZnSO4 are indispensable for obtaining an appreciable
selectivity toward cyclohexene. Otherwise, cyclohexane, the com-
plete hydrogenation product, will dominate throughout the reac-
tion course, with no or trace cyclohexene being harvested. The
reaction conditions were 413 K, the overall pressure of 4.0 MPa,
and the stirring rate of 1000 rpm, which is sufficient to eliminate
the diffusion effect [29]. The reaction conditions employed herein
are typical in the literature for benzene partial hydrogenation
[3,6–8]. The reaction course was monitored by discharging
ꢀ0.3 ml of the reaction mixture at intervals, followed by analysis
on a GC122 gas chromatograph fitted with a PEG-20 M packed col-
umn and a TCD. The catalytic performances of the catalysts were
evaluated at least in duplicate, and results from replicate runs
agreed to within 2%. The catalytic activity was expressed as the
weight-specific activity (r0) and, further, as the TOF of benzene.
The former was the amount of benzene converted per minute
per gram of the catalyst at zero reaction time, which was obtained
by procedures proposed by Hu and Chen [7]. The experimental
benzene content–reaction time (t) curve was fitted by a polyno-
mial equation, which was then differentiated, and the r0 was ac-
quired by substituting zero for t. The latter was expressed as
TOF = r0  MRu/(dispersion  W), in which MRu and W are the molar
mass of Ru and the loading of Ru on the catalyst, respectively, and
the dispersion of Ru is based on CO chemisorption. Because ben-
zene cannot be hydrogenated on the ZrO2 and B-ZrO2 supports
alone, Ru is undoubtedly the primary active site for this reaction.
So, it is more suitable to use the Ru site to calculate the TOF as a
good approximation. In heterogeneous catalysis, though it is very
difficult to define exactly the nature of the active sites, comparing
the TOFs on the same basis is advantageous for researchers to dis-
close and interpret activity difference between different catalysts
[36]. The initial selectivity toward cyclohexene (S0) was obtained
by extrapolating the fitted selectivity–time curve of cyclohexene
to zero reaction time, with the intercept being S0.
gion, and the
jump step using the Athena program of the IFEFFIT package [26].
The normalized (E) was transformed from the energy space to
the k-space with the
(k) multiplied by k2 to compensate for the
v(E) data were normalized with respect to the edge
v
v
oscillations in the high-k region. Then, the k2-weighted
v(k) data
in the k-space ranging from 3.2 to 11.4 ÅÀ1 (for the Ru foil stan-
dard, 3.2–14.0 ÅÀ1) were Fourier transformed to the R-space. The
processed
v(k) data were fitted in the R-space ranging from 0.2
to 2.8 Å (for the Ru foil, 0.8–2.8 Å) using the Artemis program of
the IFEFFIT package [26]. For disordered systems, the symmetric
Gaussian pair distribution function is invalid for the nearest neigh-
bor atom distribution, so we carried out the Gaussian approxima-
tion fitting procedure with third order cumulant representing the
big disorder in the structure [27]. From these analyses, structural
parameters, such as coordination number (N), coordination dis-
tance (R), Debye–Waller factor (
tion ( E0), were obtained.
Dr
2), and inner potential correc-
D
Diffuse reflectance infrared Fourier transform spectroscopy
(DRIFTS) of hydrogen adsorbed on the catalysts was performed
on a Nicolet 6700 spectrometer with a DTGS detector with
4 cmÀ1 resolution by signal-averaging 32 scans. Five milligrams
of the catalyst dried in He flow at 373 K was ground with
100 mg of KBr, and then about 15 mg of the mixed sample was
transferred into an in situ IR cell under the protection of He. The
sample was pretreated at 473 K for 1 h under He. After cooling to
293 K and recording the background spectrum, H2 was introduced
to replace He. The flow rate and pressure of He or H2 are
20 ml minÀ1 and 0.1 MPa, respectively. Then, the sample was
heated stepwise in the presence of H2 from 293 to 413 K at a heat-
ing rate of 5 K minÀ1. The spectra were recorded at 323, 353, 383,
and 413 K after balancing at each temperature for 30 min.
The adsorption capacity of benzene on the catalyst was exam-
ined by temperature-programed desorption (TPD) on a thermo-
gravimetric analyzer (TA Instruments SDT-Q600) attached to a
Pfeiffer Instruments GSD 301 T2 mass spectrometer (MS). The
amount of the catalyst used in the test was about 25 mg. The cat-
alyst was immersed in benzene for saturation adsorption, followed
by drying at room temperature overnight under N2. The MS spec-
trum was obtained at a heating rate of 10 K minÀ1 from 303 to
1073 K under N2 with the flow rate of 40 ml minÀ1 by tracking
the parent ion at the mass to charge ratio (m/z) of 78.
3. Results and discussion
3.1. Composition, texture, and bulk structure of the B-ZrO2 samples
Table 1 lists the compositional and textural properties of the
ZrO2 and the B-doped ZrO2 samples. The practical B/Zr molar ratios
increased monotonically with the nominal B/Zr ratios. However,
only about one-third of the prescribed amounts of B were doped
into ZrO2. A similar phenomenon was observed by Urbano et al.
on their B-ZrO2 samples [18]. It is possible that the precipitation
condition for Zr is not the optimal precipitation condition for B.
The N2 adsorption–desorption isotherms of the samples (Fig. S1)
all belonged to type IV with H3 hysteresis loop. According to
Table 1, the SBET and the pore volume (Vpore) decreased while the
2.3. Catalytic testing
Up to now, methods for benzene partial hydrogenation can be
categorized into batchwise liquid-phase [3–7] and continuous
gas-phase modes [28]. The main advantage of the former is that
it can achieve a much higher selectivity toward cyclohexene at
high conversion level of benzene [3–7]. The partial hydrogenation
average pore diameter (dpore
improvement of the doping level of B. The SBET of the present
ZrO2 sample is higher than the value reported by Chuah et al.
) increased accompanying the

 Zhou, Gongbing