4
2
V. Kartnaller et al. / Journal of Molecular Catalysis B: Enzymatic 123 (2016) 41–46
can rapidly analyze the vibrational bands of the molecules present
in the system, which may change during a reaction. Thus, tracking
and monitoring of reactions are possible [19].
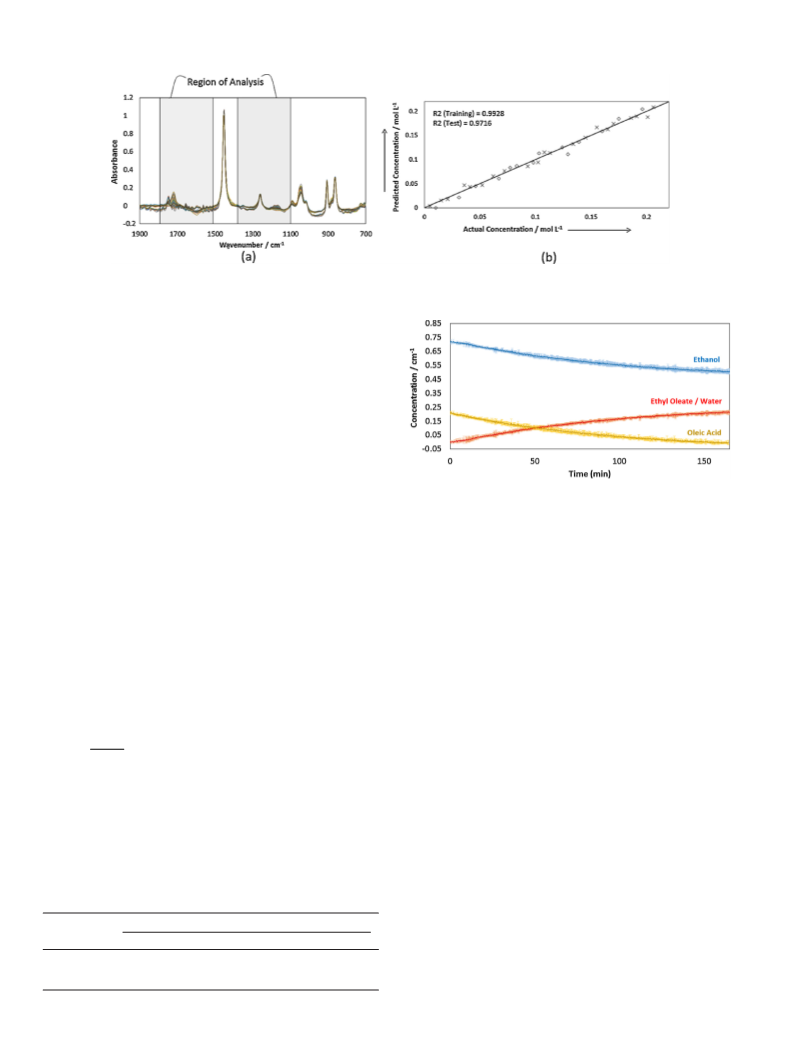
responses of the model were the concentrations of the reaction
components (oleic acid, ethanol, and ethyl oleate/water), where
each one was calculated in an individual model. A spectral region
−
1
−1
The reaction system can be more clearly understood by trans-
forming the spectroscopic data into concentration information
about the species in the system [15]. This transformation arises
from the fact that there is linearity between the spectroscopic
quantity (i.e., absorbance) and the concentration, as stated by the
Beer–Lambert law. Numerous chemometric strategies can be used
for this transformation, from a simple univariate linear regression
to a more complicated non-linear multivariate regression, when
linearity does not exist [20]. In the case of the infrared spectra
of a reaction mixture, there can be much juxtaposition between
vibrational bands of different compounds. Therefore, multivariate
regressions must be used to quantify the concentrations. The most
common regression used in these cases is partial least squares (PLS)
between 1800 and 1540 cm
and 1400–1000 cm of the first
derivative of the spectra with mean centering for the model has
used.
2.3. Reaction settings
−1
The reactions started with 0.206 mol L
of oleic acid,
−1
0
.712 mol L of ethanol, and the corresponding amount of cyclo-
◦
hexane as solvent. The temperature was set to 57 C, and after it was
stabilized, the catalyst was added. The concentration of the catalyst
was 10% w/w in relation to oleic acid. The reactions were mon-
itored by using the ATR/FT-IR probe for 165 min. As the reaction
progressed, the PLS model was used for real-time quantification of
each component. Reactions were performed in triplicate in order
to estimate the experimental variance.
[
21,22].
In the present work, an in-line real-time methodology was
used to evaluate and compare the kinetics of an esterification
reaction catalyzed with homo (mineral acid) and heterogeneous
2.4. GC–MS analysis
(
supported enzymes) catalysts. As a model for the reaction, oleic
acid was reacted with ethanol and catalyzed with hydrochloric
acid, Novozym 435, Lipozyme RM, and Lipozyme TL. ATR/FT-IR and
PLS regression modeling were used to easily evaluate the kinet-
ics of the different catalysts without multiple calibrations. Coupled
gas chromatography–mass spectrometry (GC–MS) was also used to
confirm the final conversion for the best catalyst.
The reaction conversion was determined by gas
chromatography–mass spectrometry (GC/MS) using an inter-
nal standard (IS) calibration curve for the quantification of ethyl
oleate. Pentadecanoyl propanoate was used as IS [23,24].
GC/MS analyzes were performed on a Shimadzu GC-QP2010
gas chromatography coupled to a Shimadzu GC–MS-QP2010 mass
spectrometer. Electron ionization at 70 eV ionization energy was
used. An RXi-1MS (100% methylpolysiloxane) capillary column
with 30 m, 0.25 mm i.d., and 0.25 m df was used. The carrier gas
2
. Experimental
2.1. Equipment
−1
was helium at a flow rate of 2.4 mL min . The temperature pro-
◦
gram was an isothermal period of 3 min at 210 C, then increased
at 20 C min to 290 C, and final isothermal period of 3 min. Injec-
ReactIR 45 m (Mettler Toledo) equipment was used for monitor-
◦
−1
◦
ing the reactions; it was equipped with an AgX 9.5 mm × 2 m Fiber
tion volume was 1.0 L in split mode and with 1:30 split ratio. The
(
Silver Halide), with a 6.35 mm diamond crystal with 6 internal
◦
◦
injector temperature was 290 C. The transfer line and ion source
reflections as an ATR element, ZnSe as a support/focusing element
and an MCT detector using Happ–Genzel apodization. The spectra
◦
were held at 290 C and 250 C, respectively. Samples from the
reactional media in the reaction catalyzed by Novozym 435 were
taken at times: 0, 5, 30, 55, 80, 105, 130 and 155 min. The injec-
tion samples were prepared by mixing 500 L of the 100× diluted
reaction medium solution, 50 L of the IS solution and 450 L of
cyclohexane. Analyses were performed in triplicates.
–1
were acquired in the range of 2000–650 cm with a wavenum-
−1
ber resolution of 8 cm in a 15-s interval between each spectrum
(
average of 25 scans).
The calibration and reactions were carried out in a 100 mL reac-
tor controlled with a EasyMax Workstation (Mettler Toledo). The
temperature was regulated by the equipment with a Pt 100 temper-
ature sensor and a Peltier cooling system. The reaction was stirred
at 200 rpm by using a propeller stirrer, also controlled by the equip-
ment. The reactor was coupled with a condenser, to prevent loss of
ethanol by evaporation, since the reaction temperature was close
to its boiling point.
3
. Results and discussion
Scheme 1 shows the esterification of oleic acid with ethanol,
which was used in this work as a model reaction for biodiesel
production.
The esterification reaction was monitored for 165 min, and an
IR spectrum was taken every 15 s (as an average of 25 scans). The
3D infrared surface of the time-dependent spectra throughout the
entire course of the reaction was obtained, as shown in Fig. 1 for
the reaction catalyzed with Novozym 435. Fig. 1a and b shows the
regions with the main variations in the spectra.
2.2. Multivariate calibration
Thirty-five standard mixtures of oleic acid, ethanol, water, and
ethyl oleate were prepared, simulating different conversion times
of the reaction. Table 1 shows the concentration of the components
in each standard mixture.
In Fig. 1, significant changes are shown in the region around
−
1
1750 cm (a), which correspond to the carbonyl absorption bands
The standard mixtures were maintained in the reactor with a
stirring rate of 200 rpm and at 57 C, and the spectra were acquired
of oleic acid and ethyl oleate, and in the region from 1200 to
◦
−1
1000 cm
(b), which correspond to the C O-related vibrations
as an average of 250 scans. Once the spectra were collected, a PLS
model was built using the software iCQuanti (Mettler Toledo). The
from ethanol and ethyl oleate. As the reaction progresses, the con-
centrations of the reagents (oleic acid and ethanol) decrease, and
Scheme 1. Esterification of oleic acid with ethanol.

 Kartnaller, Vinicius