Please do not adjust margins
ChemComm
Page 4 of 5
COMMUNICATION
Journal Name
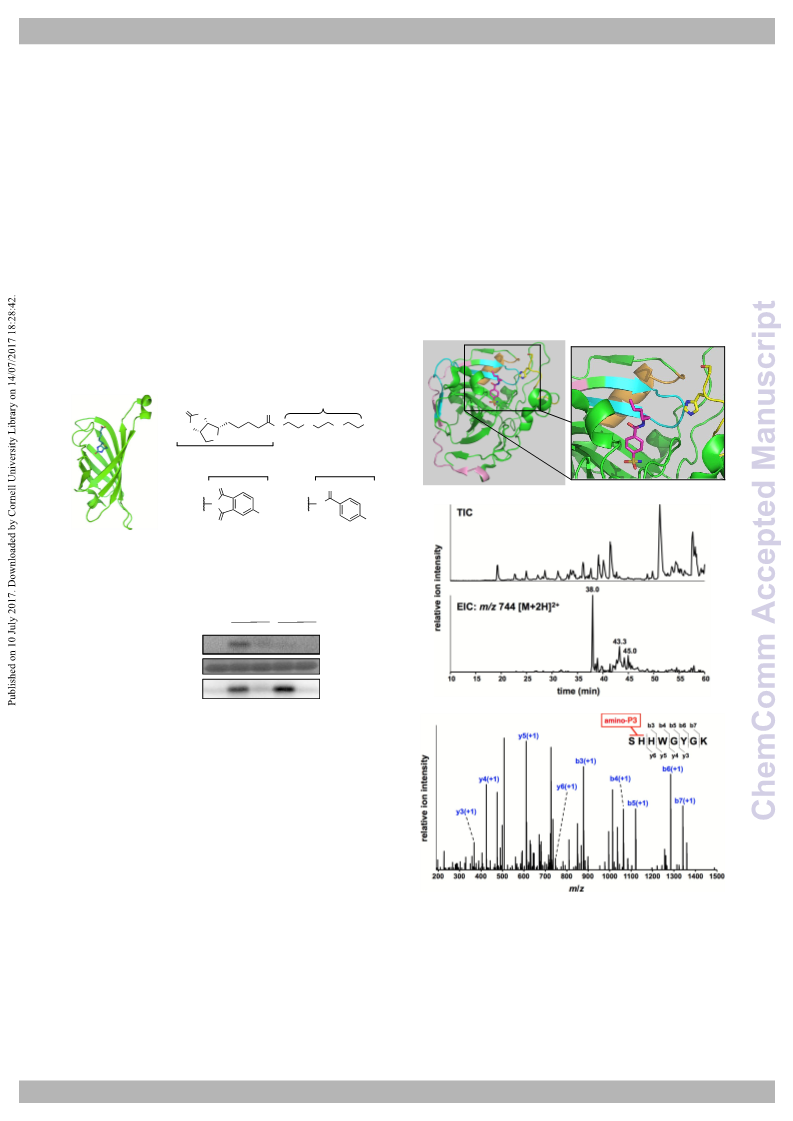
yellow, pink, cyan and orange, respectively. Ser2 and His3 are shown in stick
form. b) Chromatograms obtained with total ion current (TIC) (upper) and
extracted ion monitoring in the range of m/z 744.23–744.34, corresponding to
amino-P3-immobilized Ser2–Lys9 (lower). c) MS/MS analysis of the amino-P3-
immobilized Ser2–Lys9 peptide (Rt 38.0 min). The representative MS/MS
spectrum of the doubly charged ion at m/z 744.29 shows the peptide fragment
[Ser2–Lys9] modified with ligand–AzPI conjugate at Ser2 or His3; for details,
see Supporting Information.
1
(a) H. Park, J. Ha, J. Y. Koo, J. Park and S. B. Park, Chem.
DOI: 10.1039/C7CC03252H
and H. Waldmann, Angew. Chem. Int. Ed., 2013, 52, 2744–
2792; (c) M. Schenone, V. Dančík, B. K. Wagner and P. A.
Clemons, Nature Chem. Biol., 2013, 9, 232–240; (d) F. Cong,
A. K. Cheung and S.-M. A. Huang, Annu. Rev. Pharmacol.
Toxicol., 2012, 52, 57–78; (e) S. Sato, A. Murata, T.
Shirakawa and M. Uesugi, Chem. Biol., 2010, 17, 616–623;
(f) G. C. Terstappen, C. Schlüpen, R. Raggiaschi and G.
Gaviraghi, Nature Rev. Drug Discov., 2007, 6, 891–903.
(a) S. Pan, H. Zhang, C. Wang, S. C. L. Yao and S. Q. Yao,
Nat. Prod. Rep., 2016, 33, 612–620; (b) J. Park, M. Koh and
S. B. Park, Mol. BioSyst., 2013, 9, 544–550; (c) G. M. Simon,
M. J. Niphakis and B. F. Cravatt, Nature Chem. Biol., 2013, 9,
200–205; (d) J. Lee and M. Bogyo, Curr. Opin. Chem. Biol.,
2013, 17, 118–126.
(a) J. Park, M. Koh, J. Y. Koo, S. Lee and S. B. Park, ACS
Chem. Biol., 2016, 11, 44–52; (b) Z. Li, D. Wang, L. Li, S.
Pan, Z. Na, C. Y. J. Tan and S. Q. Yao, J. Am. Chem. Soc.,
2014, 136, 9990–9998; (c) Z. Li, P. Hao, L. Li, C. Y. J. Tan,
X. Chen, G. Y. J. Chen, S. K. Sze, H.-M. Shen and S. Q. Yao,
Angew. Chem. Int. Ed., 2013, 52, 8551–8556.
Finally, we examined CA-II labeling in living cells (Figure 7).
Red blood cells (RBCs), which highly express CA-II, were
quickly isolated from bovine blood and used immediately. The
labeling was performed under UV irradiation at 365 nm, after
incubation of RBCs and P3 for 30 min at room temperature.
We found that a 29 kDa protein corresponding to the target CA-
II was selectively labeled (lane 3).14 This indicates that P3
efficiently permeated through the cell membrane and reached
cytosolic CA-II. The fluorescent band disappeared in the
presence of 1 (lanes 4 and 5), and no labeling proceeded with
compound 2 (lane 2). Thus, the AzPI unit is available for
specific fluorescence labeling of target protein inside living
cells.
2
3
4
5
(a) H. Shi, C.-J. Zhang, G. Y. J. Chen and S. Q. Yao, J. Am.
Chem. Soc., 2012, 134, 3001–3014; (b) T. Hosoya, T.
Hiramatsu, T. Ikemoto, M. Nakanishi, H. Aoyama, A.
Hosoya, T. Iwata, K. Maruyama, M. Endo and M. Suzuki,
Org. Biomol. Chem., 2004, 2, 637–641.
T. Yamaguchi, M. Asanuma, S. Nakanishi, Y. Saito, M.
Okazaki, K. Dodo and M. Sodeoka, Chem. Sci., 2014, 5,
1021–1029.
1
-
2
2
-
3
-
4
5
5
lane
probe (0.5 µM)
1 (µM)
P3
0.5
MW
(kDa)
-
75
50
37
6
7
8
K. Chiba, Y. Hashimoto and T. Yamaguchi, Chem. Pharm.
Bull., 2016, 64, 1647–1653.
V. Wintgens and C. Amiel, J. Photochem. Photobiol. A
Chem., 2004, 168, 217–226, and references therein.
(a) M. Denda, T. Morisaki, T. Kohiki, J. Yamamoto, K. Sato,
I. Sagawa, T. Inokuma, Y. Sato, A. Yamaguchi, A. Shigenaga
and A. Otaka, Org. Biomol. Chem., 2016, 14, 6244–6251; (b)
S. Sato and H. Nakamura, Angew. Chem. Int. Ed., 2013, 52,
8681–8684; (c) S. Tsukiji, M. Miyagawa, Y. Takaoka, T.
Tamura and I. Hamachi, Nat. Chem. Biol., 2009, 5, 341–343.
J. Mecinović, P. W. Snyder, K. A. Mirica, S. Bai, E. T. Mack,
R. L. Kwant, D. T. Moustakas, A. Héroux and G. M.
Whitesides, J. Am. Chem. Soc., 2011, 133, 14017–14026.
CA-II
25
20
fluorescence
Figure 7. Labeling of endogenous CA-II by P3 in living RBCs. RBCs were
quickly isolated from bovine blood and used for the labeling. Conditions: 2 or P3
(0.5 µM), 1 (0–5 µM), RBCs, HEPES-buffered saline, and UV irradiation at 365
nm (5 min).12
9
10 S. Bräse and K. Banert in Organic Azides: Synthesis and
Applications, Eds.: N. Gritsan and M. Platz, Wiley-VCH,
Weinheim, 2010, Chapter 11.
11 P. C. Weber, D. H. Ohlendorf, J. J. Wendoloski and F. R.
Salemme, Science, 1989, 243, 85–88.
12 MS analysis of the whole protein showed that the labeling
occurred efficiently (estimated labeling yield: 29%) to the
target CA-II (see Supporting Information, Figure S6).
13 Since the labeling mainly occurred on the sequence Ser2–
Lys9, firm MS/MS data were not obtained for the other
labeled peptides (Ala37–Arg57, Met59–Lys80, and Val159–
Lys169).
In summary, the results of the two case studies (4-
sulfamoylbenzamide–CA-II and biotin–streptavidin) confirm
that the ligand–AzPI conjugate strategy enables specific
fluorescence labeling of the target protein. Not only purified
CA-II, but also endogenous CA-II in living cells was
selectively labeled and visualized without the need for complex
procedures. Since the AzPI unit is compact, it may have
relatively little effect on many ligand-target interactions, and
thus our simple affinity-labeling method should be available for
a wide range of target-ID studies, as well as for determination
of ligand-binding sites.
14 Smear in the low molecular weight region seems to be
derived from the fluorescence of hemoglobin.
This work was supported in part by Grant-in-Aid for Scientific
Research (KAKENHI, No. 26810091 and No. 16K17930 to
T.Y., and No. 26560439 to K.D.), and Platform for Drug
Discovery, Informatics, and Structural Life Science.
Notes and references
4 | J. Name., 2012, 00, 1-3
This journal is © The Royal Society of Chemistry 20xx
Please do not adjust margins

 Chiba, Kosuke