
Advanced Synthesis and Catalysis p. 1751 - 1762 (2015)
Update date:2022-08-16
Topics:
 Engels, Leonie
Henze, Manja
Hummel, Werner
Elling, Lothar
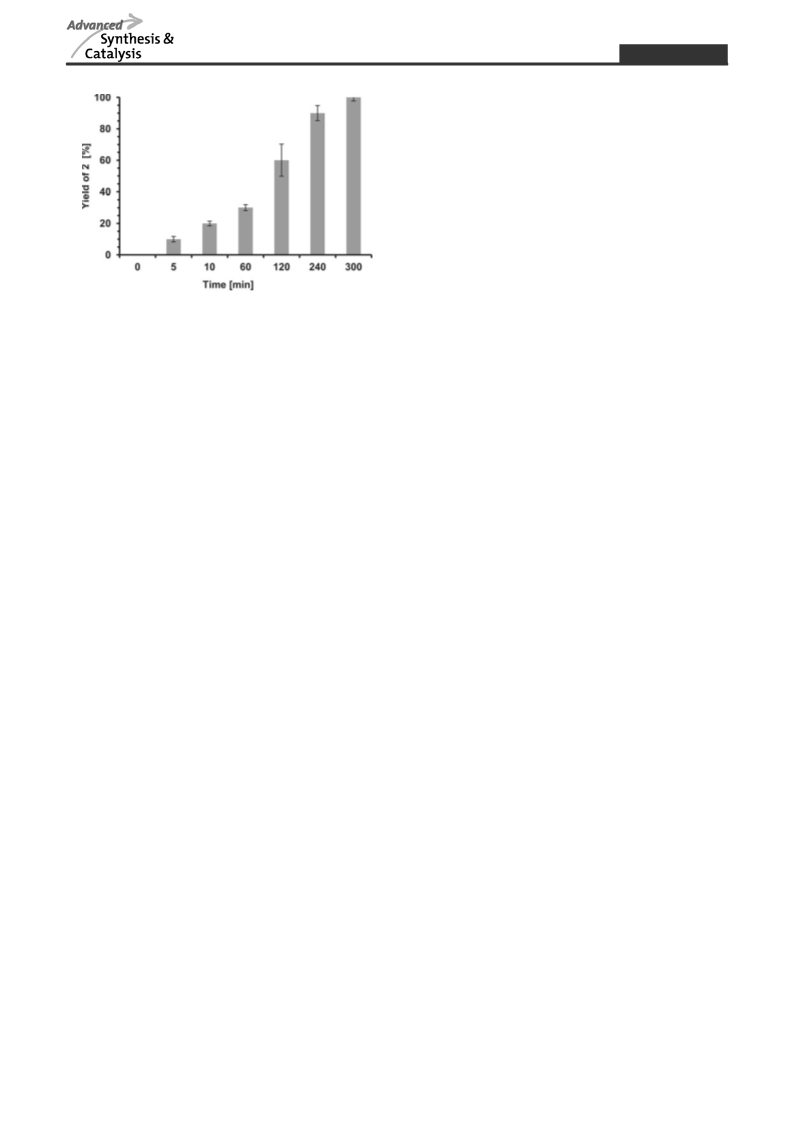
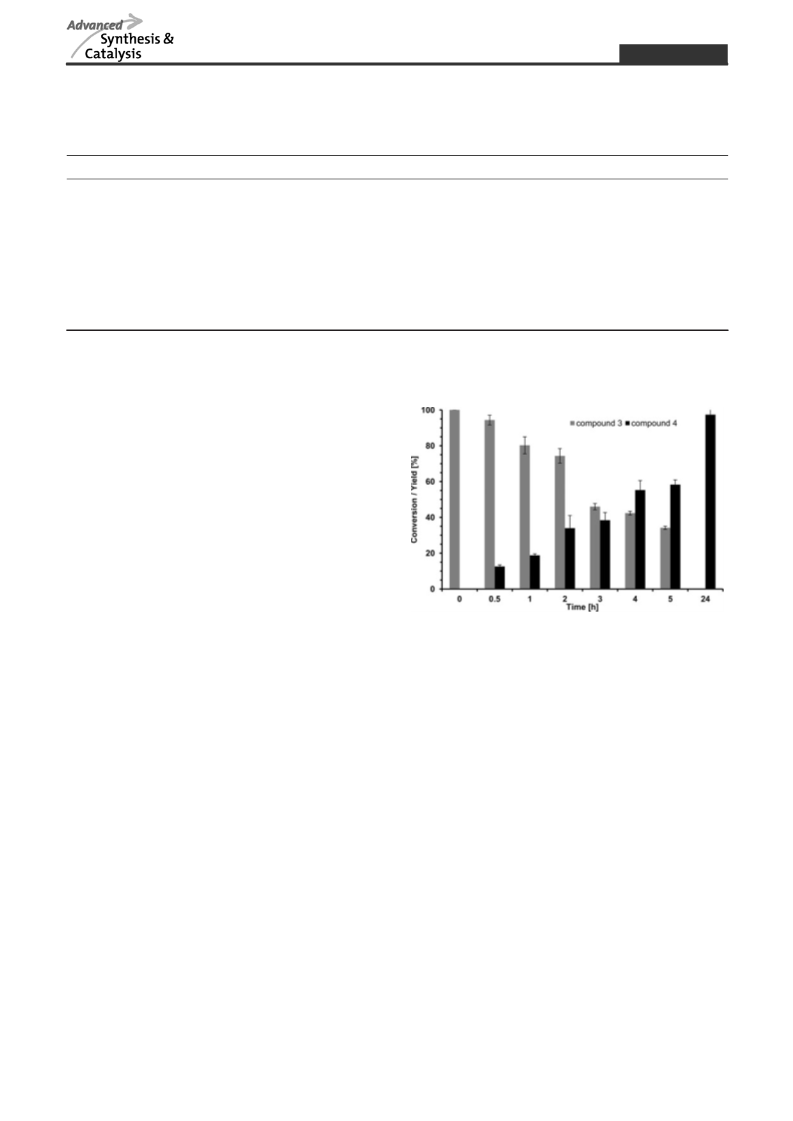
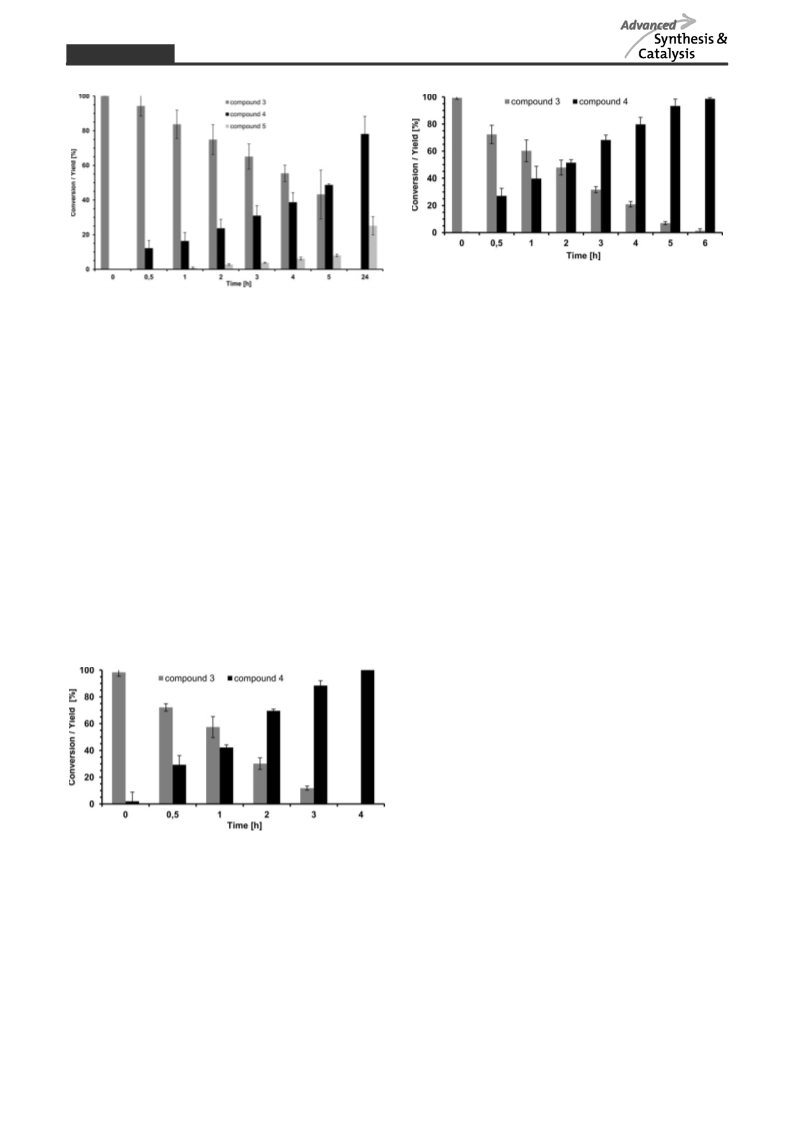
Tailor-made strategies for the stereo- and regioselective multi-step enzymatic synthesis of glycoconjugates require well characterized glycosyltransferases and carbohydrate modifying enzymes. We here report on a novel enzyme cascade for the synthesis of uridine 5′-diphospho-α-D-glucuronic acid (UDP-GlcA) and the non-sulfated human natural killer cell-1 (HNK-1) epitope including in situ regeneration of UDP-GlcA and the cofactor nicotinamide adenine dinucleotide NAD+ by the combination of four enzymes in one-pot. In the first enzyme module sucrose synthase 1 (SuSy1) is used to produce uridine 5′-diphospho-α-D-glucose (UDP-Glc) from sucrose and uridine 5′-diphosphate (UDP). The combination with UDP-Glc dehydrogenase in the second enzyme module leads to the synthesis of UDP-GlcA with concomitant in situ regeneration of the cofactor NAD+ by nicotinamide adenine dinucleotide hydride (NADH)-oxidase. In the third enzyme module the mammalian glucuronyltransferase GlcAT-P catalyzes the synthesis of the non-sulfated HNK-1 epitope by regioselective transfer of GlcA onto N-acetyllactosamine type 2 (LacNAc type 2). We present a comprehensive study on substrate kinetics, substrate specificities, variation and relation of enzyme activities as well as cross inhibition of intermediate products. With optimized reaction conditions we obtain superior product yields with streamlined synthesis costs for the expensive nucleotide sugar UDP-GlcA and cofactor NAD+.
View More


Suzhou CarbonWell Pharma-Tech Co., Ltd
Contact:Tel: + 86 (0)512-8898-1216; + 86-18606258602
Address:2358 Changan Road, Wujiang Scientific Innovation Park, Wujiang, Jiangsu Province, P. R. China 215200
website:http://www.sincerityenterp.com
Contact:+86-571-88111846
Address:Binjiang Area, Hangzhou
Zhejiang Golden-Shell Pharmaceutical Co.,Ltd.
Contact:+86-576-87501888 / 87501988
Address:No.89 Zhongxing Road. Li'ao, Yuhuan, Zhejiang, China
Weifang Adde Economic And Trade Co.,LTD.
Contact:86-536-8885548
Address:Room 1402,Wanda Plaza B Block,No.958,Yuanfei Road,Kuiwen District
Contact:86-574-83851061 86-574-87083208
Address:Room 905, No.3 Building,East Business Center, 456 Xingning Road, Ningbo City,China
Doi:10.1039/c7ob01026e
(2017)Doi:10.1246/cl.2001.646
(2001)Doi:10.1246/bcsj.44.3086
(1971)Doi:10.1021/acs.orglett.7b01500
(2017)Doi:10.1039/b924187f
(2010)Doi:10.1021/jacs.1c03491
(2021)
