D. Hazafy et al. / Dyes and Pigments 88 (2011) 315e325
317
preparations, samples were admitted to Wilmad 535-PP-7 precision
5 mm Ø NMR tubes in preparation for data collection.
under TopSpin (version 2.0, Bruker Biospin) using the T1/T2 analysis
module in order to fit the data to the standard expression of diffusion
coefficient as a function of gradient strength.
2.3. NMR spectroscopy
2.4. Mass spectrometry
NMR spectra were acquired at a magnetic field of 14.1 T using
a Bruker Avance III NMR spectrometer operating at a 1H resonance
frequency of 600.13 MHz and working under TopSpin version 2.0
(Bruker Biospin, Karlsruhe, Germany) on an HP XW3300 worksta-
tion running under Windows XP. Typically all NMR spectra were
acquired on the prepared samples using a broadband observe pro-
behead equipped with a z-pulsed field gradient coil [BBO-z-atm].
One-dimensional (1D) 13C-{1H} NMR spectra were acquired over
a frequency width of 33.3 kHz (220 ppm) centred at a frequency
offset equivalent to 100 ppm. Typically data from 50,000 transients
were digitized into 32786 data points using an acquisition time
aq ¼ 0.5 s and a relaxation delay, d1 ¼ 0.7 s.1D 1H NMR spectra were
acquired over a frequency width of 12.3 kHz (20.55 ppm) centred at
a frequency offset equivalent to 6.175 ppm into 65536 data points
during an acquisition time aq ¼ 2.66 s with a relaxation delay d1 ¼2 s
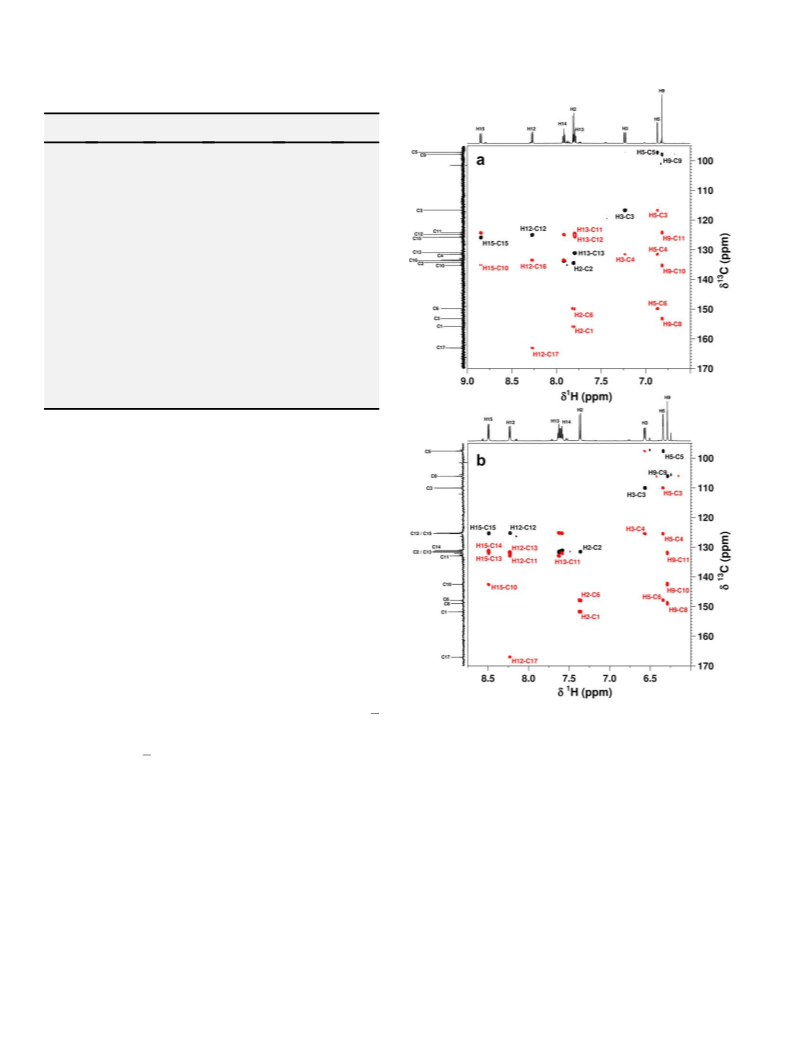
for each of 32 transients. Phase-sensitive two-dimensional (2D)
[1H, 13C] HSQC NMR spectra were acquired using a sensitivity
improved, gradient coherence selection pulse programme in an
echo/anti-echo acquisition mode (Bruker pulse programme
hsqcetgpsi2). Typically 4 transients were acquired over frequency
widths of u2 ¼ 6 kHz (10 ppm) and u1 ¼ 25.6 kHz (170 ppm) into
2048 complex data points for each of 256 t1 increments (aq
MS spectra for both forms of NB and TH were recorded using an
ESI-MS (ThermoFinnigan LCQ DUO MS) instrument using the direct
injection port. An LDI-MS (Shimadzu, AXIM-CFR) was also used to
record MS spectra of NB and TH. MS spectra on commercial NB and
TH samples were also recorded for comparison purposes.
2.5. Molecular modelling
Structural models used to aid visualization of the non-covalent
self-assembly of molecules used in these studies were built within
Sybyl (Version 6.3, Tripos Inc.,) running on a Silicon Graphics
Extreme workstation operating under IRIX version 5.2. Crude
structures were energy minimized using 500 steps of a conjugate
gradient energy minimization molecular mechanics routine.
Charges were applied using a GasteigereHuckel routine. Pairs of
minimized structures were manually manipulated in order to
match inter-molecular NOEs. Key inter-proton restraints were
applied to dimers using a range restraint of 2.5e3.5 Å with a force
constant of 10 kcal molꢀ1 Å2. 1000 steps of conjugate gradient
energy minimization were applied to allow the restraints to guide
the orientation of molecules with respect to one another and to
reduce instances of bad contacts.
[
u2] ¼ 170 ms, aq[u1 max ¼ 5 ms) with a relaxation delay d1 ¼ 2.0 s.
]
Absolute value 2D [1H, 13C] HMBC NMR spectra were acquired
without decoupling during the acquisition time and with gradient
2.6. Numerical analysis
selection and
a low-pass filter (Bruker pulse programme
hmbcgplpndqf). Typically 64 transients were acquired over
frequency widths of u2 ¼ 6 kHz (10 ppm) and u1 ¼ 33.55 kHz
(222 ppm) into 2048 complex data points for each of 256 t1 incre-
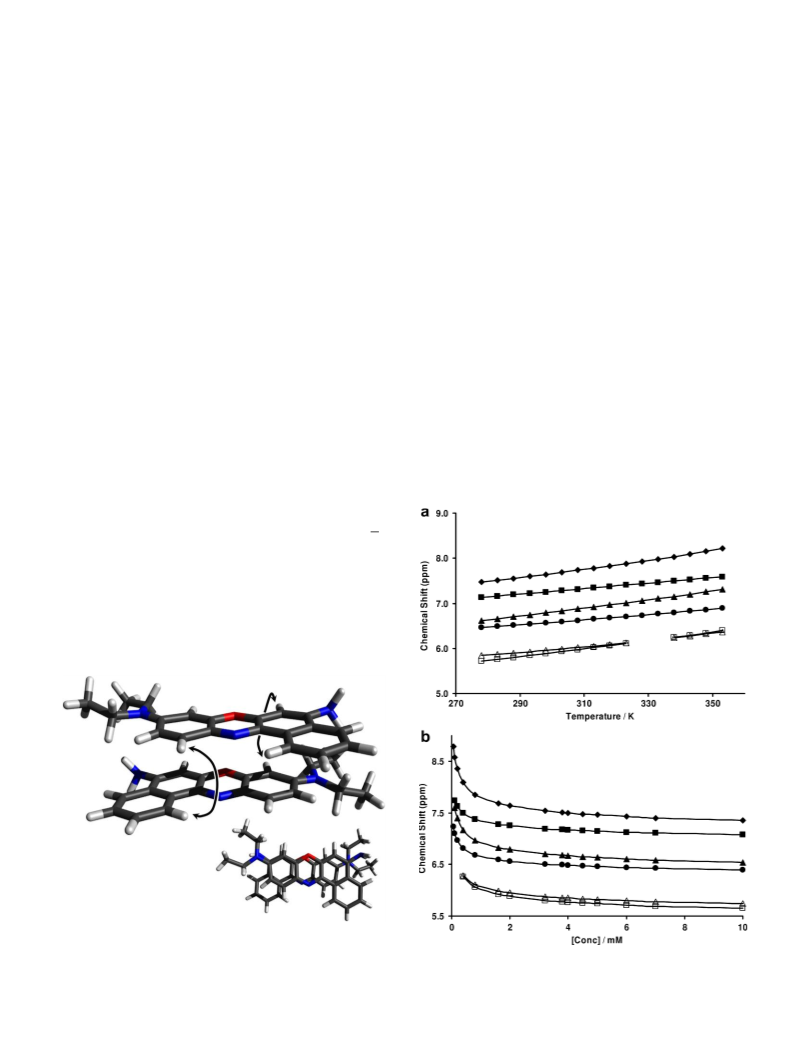
The experimental NMR dilution and variable temperature data
were analysed in terms of an indefinite non-cooperative model
of association [23], which assumes sequential addition of the
monomer X to an aggregate Xiꢀ1 containing i-1 molecules, with
equilibrium self-association constant K. The key relations are given
by the dependence of the experimentally observed chemical shift,
ments (aq[u2] ¼ 170 ms, aq[u1 max ¼ 3.8 ms) with a relaxation delay
]
d1 ¼ 2.0 s. 2D [1H, 1H] NOESY, COSY and TOCSY NMR data were
typically acquired phase sensitive using a States-TPPI mode of data
acquisition over frequency widths u2
2048 complex data points with 16 transients for each of 256 t1
increments. Mixing times, m, were as follows: for TOCSY data
¼ u1 ¼ 6 kHz (10 ppm) into
d
, on the concentration of the dye, x0 [23] in which
pffiffiffiffiffiffiffiffiffiffiffiffiffiffiffiffiffiffiffi
s
2Kx0 þ 1 ꢀ 4Kx0 þ 1
d
¼
dm þ ðdd
ꢀ
dmÞ$
;
(1)
sets sm ¼ 70 ms; for NOESY data sets sm ¼ 200 ms, 270 ms and
1000 ms. For NOESY and TOCSY data sets acquired on samples
solubilized in pyridine-d5, a WET solvent suppression scheme [20]
was used with 13C decoupling during the solvent signal selective
pulses to cleanly suppress the residual pyridine solvent signals
without undue disruption of the NMR signals associated with the
solute. Diffusion measurements were carried out using a bipolar
gradient pulse program (Bruker pulse program ledbpgppr2s) in
which presaturation was used to suppress the residual solvent signal
during the recycle delay. Typically 32 gradient increments were
used by which the gradient strength was varied linearly in the range
2%e95% of full gradient strength (54 G/cm with a rectangular
gradient) using a sine-shaped gradient. Typically the gradient pulse
duration was set to 1 ms and the diffusion period to 200 ms. With
increasingly dilute samples, the number of transients was increased
accordingly in order to allow fordiffusion coefficients to be evaluated
with a reasonable fit of the experimental data to theory (i.e. number
of transients (NS) per FID varied in the range NS ¼ 32 to NS ¼ 256 for
sample concentrations in the range 5e0.2 mM). The robustness of
the approach used for diffusion measurements against the effects of
convectionwere assessed by use of a convection compensating pulse
program. Within experimental error no differences were found in
the results observed using the convection compensated approach
compared with the non-compensated approach, thereby validating
the method adopted for this study. Diffusion data were processed
Kx0
where dm and dd are the chemical shifts in monomer and dimer
forms (or at the ends of an aggregate) of the dye in solution,
respectively. Minimization of a discrepancy function between the
experimental
in the calculation of optimal values of the variable parameters
(K, dm dd). The thermodynamical parameters, enthalpy ( H) and
entropy (
d(x0) and theoretical (eqn. (1)) chemical shifts results
,
D
DS), for the self-association reaction were calculated from
the temperature dependencies of 1H chemical shifts replacing the
K value in equation (1) by the corresponding relation K(T) according
to the van’t Hoff’s formalism [23]:
KðTÞ ¼ expð
D
S=R ꢀ
D
H=RTÞ
(2)
In order to increase the quality of fit of the calculated thermo-
dynamical parameters in this work, two sets of variable tempera-
ture data were used within the numerical analysis namely at high
(x0 ¼ 2 mM) and low (x0 ¼ 0.2 mM) concentrations of the dye.
3. Results and discussion
3.1. Nile Blue (NB)
Fig. 1a shows the UVevis absorption spectra of NB recorded
under different solution conditions, the results of which were very

 Hazafy, David