lamp intensity profile also at each time step. After trials
involving smaller time increments were found to give
identical results, the time interval was chosen to be 0.25 s.
All of the data used for the simulations are collected in
Table 3.
on the square of the light intensity, both of these details
lead to higher real rates of radical-radical reactions than
in our simulation. In order to agree with experiment, the
simulation must compensate by using a much larger
assumed value for the associated rate constant (reaction
25).
Kinetic simulations, in general, are independent of many
of the details of the proposed reaction scheme. Thus, for
instance, the exact sequence ofreactions leading from acetic
acid to oxalic acid is irrelevant as long as no stable
intermediates are formed and no intermediates couple this
reaction to others outside the acetic acid/ oxalic acid “black
box”. On the other hand, the photolysis of hydrogen
peroxide is an example where the details are relevant, since
the hydroxyl radicals couple this reaction to many others.
Simulations of the photolysis of hydrogen peroxide in
the absence of acetone involved the reactions 1-4 as well
as reactions 40 and 41 in Table 3. Reaction 41 is a chain
propagation step that results in a quantum yield for
hydrogen peroxide destruction greater than one under low
light flux conditions. By contrast, reaction 40 results in a
quantum yield less than one for very high light intensities.
Under our conditions, these latter two reactions had a
negligible effect. As discussed previously, this entire set of
reactions gives a quantum yield of unity for hydrogen
peroxide destruction. However, our experimental results
could only be fit if the quantity φOHGo was reduced to 80%
of its expected value. Either the primary quantum yield for
hydroxyl radical production had to be reduced to 0.80 or,
if the literature value of 1.0 is accepted, the value for Go is
only 80% of that measured by actinometry. The value for
φOHGo measured in our experiments on hydrogen peroxide
photolysis was used in our acetone simulations.
Acknowledgments
This work was supported financially by a Collaborative
Research and Development Grant jointly funded by the
Natural Sciences and Engineering Research Council of
Canada and Solarchem EnvironmentalSystems ofMarkham
Ontario, Canada. We thank Dr. Stephen Cater, Dr. Ali
Safarzadeh-Amiri, Mr. Keith Bircher, P. Eng, and Dr. R. D.
Samuel Stevens of Solarchem Environmental Systems for
their helpful comments and support during the conduct of
this research.
Literature Cited
(1) Omura, K.; Matsuura, T. Tetrahedron 1968, 24, 3475.
(2) Ogata, Y.; Tomizawa, K.; Fujii, K. Bull. Chem. Soc. Jpn. 1978, 51,
2628.
(3) Bolton, J. R.; Cater, S. R. In Aquatic and Surface Photochemistry;
Helz, G. R., Zepp, R. G., Crosby, D. G., Eds.; Lewis Publishers:
Boca Raton, FL, 1994; pp 467-490.
(4) Leitzke, O.; Whitby, G. E. In Proceedings: A Symposium on
Advanced Oxidation Processes for the Treatment of Contaminated
Water and Air, June 4-5, 1990, Toronto ON, Canada.
(5) Weir, B. A.; Sundstrom, D. W.; Klei, H. E. Hazard. Waste Hazard.
Mater. 1987, 4, 165.
(6) Sundstrom, D. W.; Weir, B. A.; Klei, H. G. Environ. Prog. 1989,
8, 6.
(7) Peyton, G. R.; Smith, M. A.; Peyton, B. M. Photolytic Ozonation
for Protection and Rehabilitation of Ground-Water Resources:
A Mechanistic Study; Report 87-206; University of Illinois Water
Resources Center: 1987.
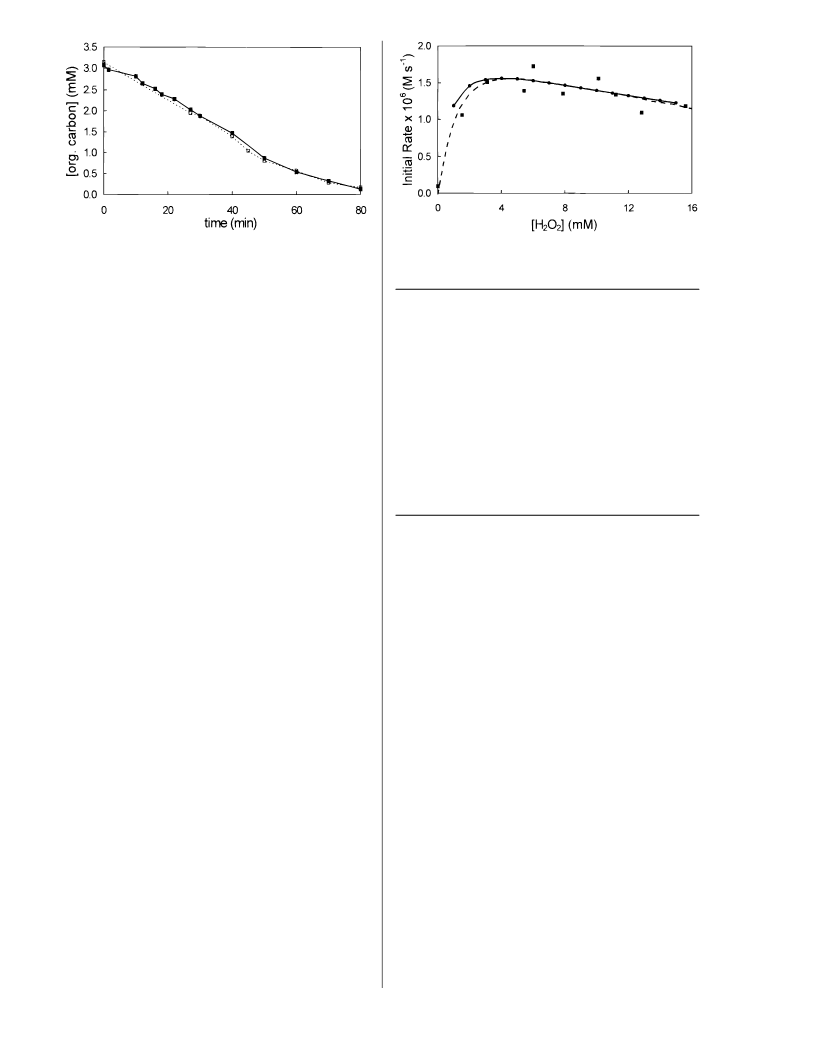
The initial simulations did not include the acetone
recycling reaction 25, and the calculated rate of disap-
pearance of acetone was much greater than that observed.
Attempts to modify our reaction scheme by including steps
such as
(8) Sundstrom, D. W.; Klei, H. E.; Nalette, T. A.; Reidy, D. J.; Weir,
B. A. Hazard. Waste Hazard. Mater. 1986, 3, 101.
(9) Wolfrum, E. J. AKineticModel ofthe H2O2/UVProcess;Symposium
on Environmental Applications of Advanced Oxidation Tech-
niques, EPRI & NSF, Feb 1993, San Francisco, CA.
(10) Glaze, W. H.; Lay, Y.; Kang, J. W. Ind. Eng. Chem. Res. 1995, 34,
2314.
(11) Frankenburg, P. E.; Noyes, W. A., Jr. J. Am. Chem. Soc. 1953, 75,
2847.
2‚OH + CH3COCH3 f products
(46)
(12) Gardner, E. P.; Wijayaratne, R. D.; Calvert, J. G. J. Phys. Chem.
1984, 88, 5069.
reduced the discrepancy only slightly and also led to
decreased hydrogen peroxide destruction. Once recycling
was introduced, reasonable agreement for both acetone
and hydrogen peroxide destruction rates could be obtained.
If acetic acid destruction is considered to go entirely by
way of oxalic acid, the concentration of oxalic acid was
calculated to be approximately twice that observed. In-
troducing a branching reaction, such that half of the acetic
acid forms oxalic acid while the other half generates formic
acid, solved this problem. This branching is supported by
experimental results that detected formic acid and oxalic
acid when aqueous acetic acid was photolyzed in the
presence of hydrogen peroxide.
The overall agreement of the simulation results with the
observed data leads us to believe that the scheme is
essentially correct. However, the fraction of acetone that
we require to be recycled (43% at the beginning of the
reaction) is surprisingly large.
The value of the rate constant for acetone recycling as
reported in Table 3 is unrealistically large and is a result of
a computational artifact. Our simulation uses the average
light flux, whereas the actual experimental equipment has
a separate reactor and reservoir. Moreover, the illumination
of the reactor from a central UV lamp is nonuniform. Since
the rate of radical-radical reactions depends essentially
(13) Nicholson, A. J. C. Can. J. Chem. 1983, 61, 1831.
(14) Dalton, J. C.; Turro, N. J. Annu. Rev. Phys. Chem. 1970, 21, 499.
(15) Berces, T. In Comprehensive Chemical Kinetics; Bamford C. H.,
Tripper, C. F., Eds.; Elsevier Publishing Co.: Amsterdam, The
Netherlands, 1972; Vol. 5, p 309.
(16) Pieck, R.; Steacie, E. W. R. Can. J. Chem. 1955, 33, 1304.
(17) Noyes, W. A., Jr.; Porter, G.; Jolley, J. E. Chem. Rev. 1956, 56, 49.
(18) Volman, D. H.; Swanson, L. W. J. Am. Chem. Soc. 1960, 82, 4141.
(19) Anpo, M.; Kubokawa, Y. Bull. Chem. Soc. Jpn. 1977, 50, 1913.
(20) Qureshi, M.; Tahir, N. A. J. Phys. Chem. 1932, 36, 2670.
(21) The 200-300 nm photon flux was obtained from the total 200-
500 nm photon flux by using the known spectral emission from
the 1 kW Solarchem lamp. We calculated that 46% of the 200-
500 nm photon flux lies in the 200-300 nm range.
(22) Murov, S. L.; Carmichael, I.; Hug, G. L. Handbook of photo-
chemistry, 2nd ed.; Marcel Dekker Inc.: New York, 1993; p 299.
(23) Sutton, F. A Systematic Handbook of Volumetric Analysis or The
Quantitative Determination of Chemical Substances by measure,
applied to liquids, solids and gases, 13th ed.; Butterworths
Scientific Publications: London, UK, 1955; p 307.
(24) Czapski, G.; Bielski, B. H. J. J. Phys. Chem. 1963, 67, 2180.
(25) Baxendale, J. H.; Wilson, J. A. Trans. Faraday Soc. 1957, 53, 344.
(26) Weeks, J. L.; Matheson, M. S. J. Am. Chem. Soc. 1956, 78, 1273.
(27) Hunt, J. P.; Taube, H. J. Am. Chem. Soc. 1952, 74, 5999.
(28) Dainton, F. S.; Rowbottom, J. Trans. Faraday Soc. 1953, 49, 1160.
(29) Buxton, G. V.; Greenstock, C. L.; Helman, W. P.; Ross, A. B. J.
Phys. Chem. Ref. Data 1988, 17, 513.
(30) Bielski, B. H. J.; Cabelli, D. E.; Arudi, R. L.; Ross, A. B. J. Phys.
Chem. Ref. Data 1985, 14, 1041.
(31) Handbook of Chemistry and Physics, 72nd ed.; Lide, D. R., Ed.;
CRC Press Inc.: Boca-Raton, FL, 1991-1992; pp 8-39.
9
VOL. 30, NO. 7, 1996 / ENVIRONMENTAL SCIENCE & TECHNOLOGY 2 3 8 9

 Stefan, Mihaela I.