A. Mukherjee, S. Ghosh, S. Ghosh et al.
Journal of Molecular Liquids 337 (2021) 116504
prepared by dilution of the 1f, 1h, 1i in DMSO in 0.01 M Tris-buffer
as required. The concentration of ctDNA (purchased from Sigma-
between 0 and 50 mM in a total volume of 3 ml using 0.01 M
Tris-HCl (pH 7.4) containing 1f, 1h, 1i and ctDNA (50 mM each) in
two different experiments. Excitation was performed at 335 nm
and the emission spectra were recorded from 350 to 550 nm.
Aldrich, USA) was varied from 0 to 60
taken at 298 K.[24]
lM. All measurements were
2.3.4.2. Fluorescence studies.
2.3.4.6. DNA melting studies. The DNA melting study was performed
in the absence and presence of 1f, 1h, 1i by monitoring the absor-
bance of ctDNA over a wide range of temperature ranging from 40°
to 85 °C. The absorbance of the compounds were monitored at
260 nm and then plotted as a function of temperature. The values
of the melting temperature (Tm) were determined as the transition
midpoint of the melting curve.
2.3.4.2.1. Steady state and time resolved fluorescence measurement.
Fluorescence experiments were carried out by fluorometric titra-
tion using a Hitachi F-7100 spectrophotometer equipped with a
xenon flash lamp using 1.0 cm quartz cells. The excitation of 1f,
1h, 1i was done at 335 nm and the emission spectra were recorded
in the range of 350–550 nm, with the widths of both the excitation
and the emission slits 10 nm. The fluorescence titration was carried
out by keeping the concentration of 1f, 1h, 1i constant at 10 mM in a
reaction mixture of 2.5 ml and the ctDNA concentration was varied
from 0 to 80 mM.
Time resolved fluorescence life time measurement was done
using the time correlated single photon counting (TCSPC) tech-
nique.[25] After exciting the samples at kex = 340 nm and using a
picoseconds diode laser (IBH-NanoLED N-340 L light source with
full width half maxima, fwhm, ~750 ps), the signals were collected
at the magic angle polarization with the help of Hamamatsu MCP
Photomultiplier (model R-3809U-50).[27] Goodness of fits was
evaluated from the v2 criterion and visual observation of the resid-
uals of the fitted functions to the data. The emission was fixed at
356 nm. For analyzing multiexponential fluorescence decay (I(t))
the following expression was employed.[25]
2.3.4.7. Effect of urea. For further elucidate the binding interaction
of 1f, 1h, 1i with ctDNA with the help of denaturation study, we
have employed urea as a denaturataing agent. In a fixed volume
of ctDNA bound 1f, 1h, 1i complex, in which both ctDNA and 1f,
1h, 1i are in same concentration, was titrated with varying the con-
centration of urea from 0 to 1(M). Upon exciting the complex at
335 nm the emission spectra were recorded from 350 to 550 nm.
2.3.4.8. Circular dichroism spectral studies. Circular dichroism mea-
surements of ctDNA alone and 1f, 1h, 1i bounded ctDNA were
recorded on a JASCO (J-815) spectropolarimeter which was con-
nected with a highly sensitive temperature controller unit, apply-
ing a cylindrical cuvette of 0.1 cm path-length at 298 K. The
described CD profiles were recorded in a range from 200 to
320 nm with a mean of four consecutive scans obtained at
20 nm minꢁ1 scan rate with properly rectified baseline. The back-
ground spectrum of the buffer solution (0.01 M Tris-HCl, pH 7.4)
was subtracted from the spectra of ctDNA and the 1f, 1h, 1i-
ctDNA complex. The molar ratios of ctDNA concentration to 1f,
1h, and 1i concentration were 1:0, 1:0.5, 1:1 1:1.5, 1:2, 1:2.5 and
1:5. An average of four scans was taken in all the experiments.
X
IðtÞ ¼
iaiexpðꢁt=si
Þ
ð1Þ
In which ai stands for the pre-exponential factor (amplitude)
regarding the ith decay time constant
si.[25] The intensity of fluo-
rescence of biexponential decay for a given k is given by [26]
Z
1
Fk ¼
FkðtÞdt
ð2Þ
0
Mean fluorescence lifetime (
tings were calculated from the decay times (s1 and s2) and the nor-
malized pre-exponential factors (a1 and a2) using the following
relations.
s
avg) for exponential iterative fit-
2.3.4.9. Molecular modelling and docking. The molecular docking
analysis for the binding interaction of 1f, 1h, 1i with ctDNA was
carried out with Auto Dock 4.2 set of programs which utilizes
the Lamarckian Genetic Algorithm (LGA) implemented therein.
From the protein data bank the endemic 3D structure of B-DNA
(for docking analysis) has consented bearing PDB ID: 1BNA.[28]
The necessary file of the 1f, 1h, 1i, for docking with ctDNA, was pro-
duced through coupled usage of Gaussian 09 [22] and Auto Dock
4.2 [29] software packages. Appling Gaussian 09 suite of programs
the geometry of 1f, 1h, 1i was first optimized at DFT/B3LYP/6-31G
(d) level of theory. The resultant geometry of 1f, 1h, 1i was read in
Auto Dock 4.2 software incompatible file format, from which the
necessary file was created in Auto Dock 4.2. After adjusting the grid
size to 60, 60, and 120 Å along X-, Y-, and Z-axis with a spacing of
grid 0.375 Å. For the auto docking the following parameters are
used. These are as follows: GA population size = 150; maximum
sav
¼
s
1a1 þ
s2a2
ð3Þ
g
2.3.4.3. Competitive displacement assay. The ethidium bromide (EB)
displacement assay was performed using 20 mM ctDNA in presence
of 5 mM EB and titrated with an increasing concentration of 1f, 1h
and 1i from 0 to 80 mM. The EB-ctDNA complex was excited at
475 nm and the emission spectra were recorded from 520 to
750 nm. Similarly AO-ctDNA complex was titrated with an increas-
ing concentration of 1f, 1h and 1i from 0 to 80 mM upon excitation
at 480 nm and the emission spectra were recorded between 500
and 670 nm. In the Hoechst 33,258 displacement assay, 5 mM
Hoechst 33258, a well-known groove binder was added to 20 mM
ctDNA and titrated with an increasing concentration of 1f, 1h, 1i
from 0 to 80 mM. The Hoechst 33258-ctDNA complex was excited
at 343 nm and the emission spectra were recorded from 400 to
650 nm.
number of energy evaluations
=
2500000; GA crossover
mode = two points. For each and every docking simulation the con-
former which has lowest binding energy was searched out of ten
different conformations, and for further analysis, consequent min-
imum energy structure was applied. The PyMOL software package
was employed for visualizations of the docked conformation.[30]
2.3.4.4. Iodide quenching experiment. Iodide quenching studies were
performed in the absence and presence of ctDNA. The emission
spectra were recorded either in the absence or presence of 50 mM
ctDNA in 3 ml of reaction mixture, which included 50 mM 1f, 1h
and 1i and increasing concentrations of KI from 0 to 16 mM.
3. Results and discussion
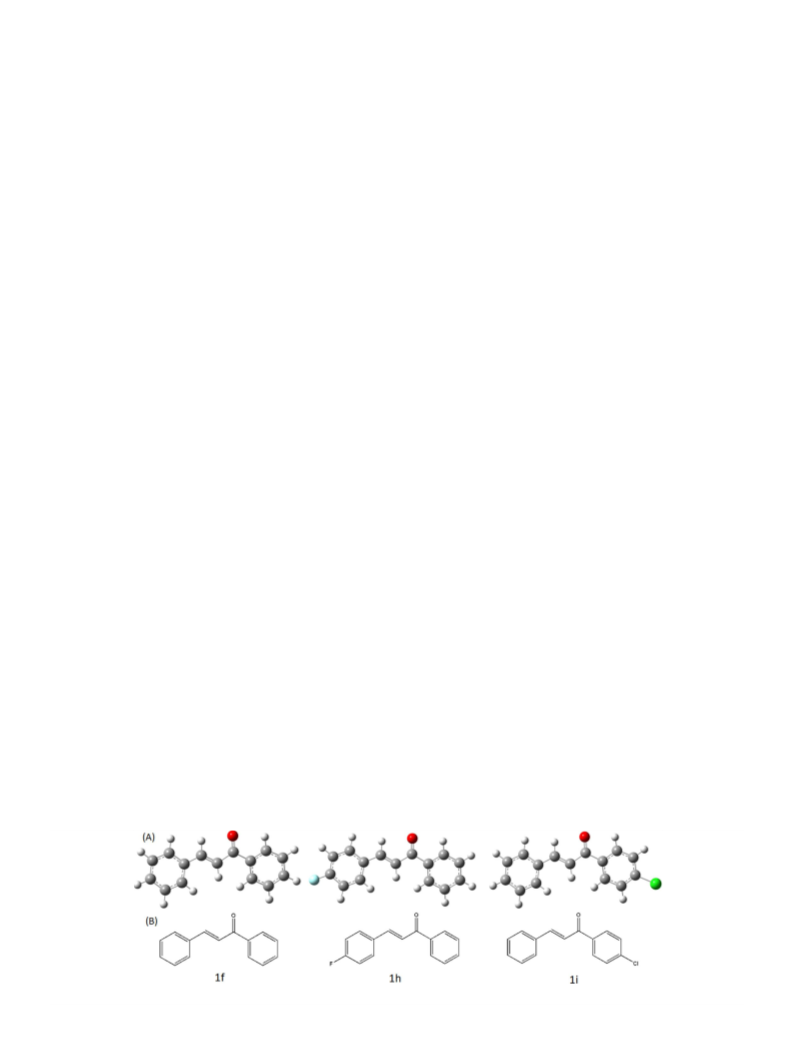
3.1. Synthesis and characterization
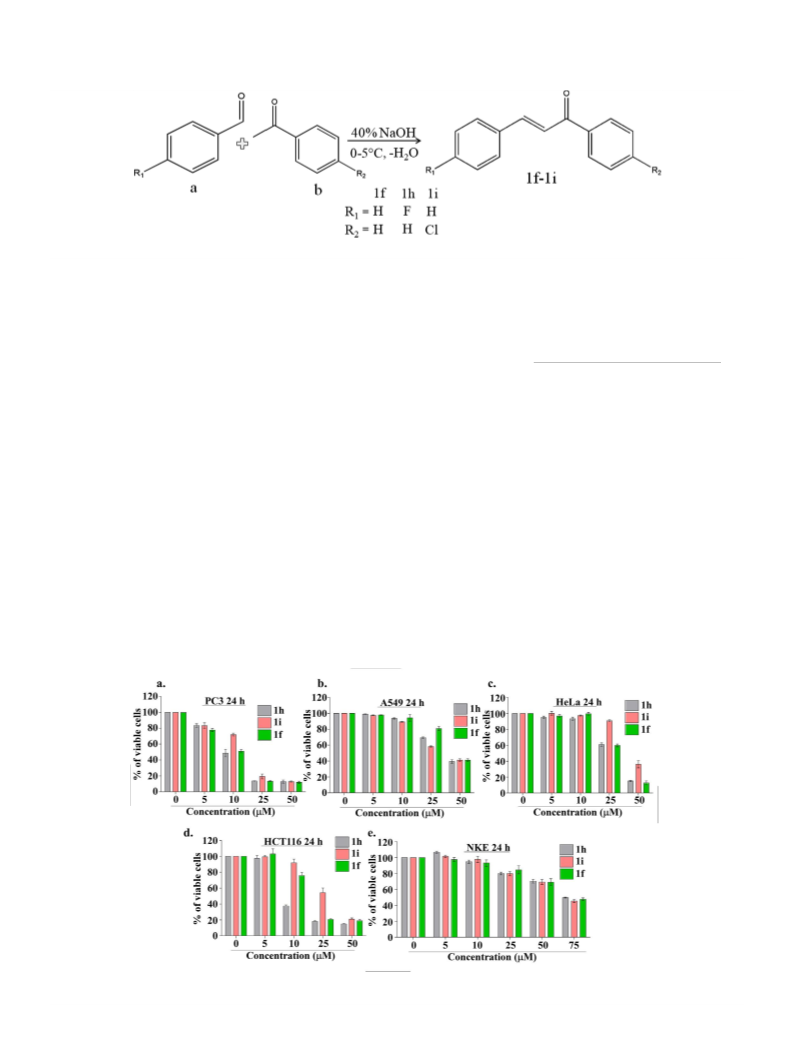
The chalcone and its halogen substituted derivative were syn-
thesized using Claisen-Schmidt condensation reaction (Scheme 2)
of substituted benzaldehyde (a) and different substituted
2.3.4.5. Effect of ionic strength. The effect of ionic strength was stud-
ied as reported earlier [27] by varying the concentration of NaCl
3

 Ghosh, Sudipta