Y. Wang et al. / Journal of Molecular Catalysis B: Enzymatic 88 (2013) 14–19
15
adjusted to pH 7.0. Rich medium 2 (RM 2) contained 20 g of glu-
cose, 21 g of peptone, 9 g of yeast extract, 2 g of K HPO , 0.75 g of
search. A phylogenetic tree was constructed by using Clustal X ver-
sion 2.0, MEGA version 4.0 [17] based on the homologous 16S rDNA
sequences.
2
4
KH PO , 1.8 g of MgSO ·7H O and 2 g of NaCl in 1 l of distilled water,
2
4
4
2
and was adjusted to pH 8.0.
Gas chromatography (GC) analysis was performed by Agilent
2.4. Cultivation conditions and preparation of resting cells
7
2
890 gas chromatography equipped with FID and Gamma DEX
25 column (SUPELCO, USA, 30 m × 0.25 mm × 0.25 m) under
Nocardia sp. WY1202 was inoculated into 20 ml of RM 2 for 48 h
the following conditions: The injector and detector temperatures
were 220 C, He is used as the carrier gas with a flow rate of
2
and 10 ml of the culture liquid (inoculum size 1:50) was transferred
◦
◦
into 500 ml of RM 2 which was constantly shaken at 30 C and
◦
ml/min. Column temperature was 120 C. The retention times
250 rpm for 72 h. R. erythropolis WY1406 was inoculated into 20 ml
of RM 1 for 24 h and 4 ml of the culture liquid (inoculum size 1:50)
was transferred into 200 ml of RM 2 which was constantly shaken at
were 13.83, 18.02 and 20.13 min for 3-quinuclidinone, (S)- and
R)-quinuclidinol, respectively. Alternatively, the optical purity of
-quinuclidinol was also measured by benzoylating the product
(
3
◦
30 C and 250 rpm for 48 h. The cells were harvested by centrifuga-
with benzoyl chloride which was analyzed by high performance
liquid chromatography (HPLC) under the following conditions:
chiral colum CHIRALPAK AD-H (Daicel Chemical Industries Ltd.,
tion (7875 × g, 20 min) and washed thoroughly with physiological
saline (0.85% NaCl) to give the resting cells for use in the reduction.
4
.6 mm × 250 mm); mobile phase, hexane–isopropanol (90/10) at
2.5. Time course of carbonyl reductase production of Nocardia sp.
WY1202 and R. erythropolis WY1406
flow rate of 0.8 ml/min; detection wavelength, 254 nm. The reten-
tion times were 12.76 and 21.98 min for (R)- and (S)-quinuclidinol,
respectively.
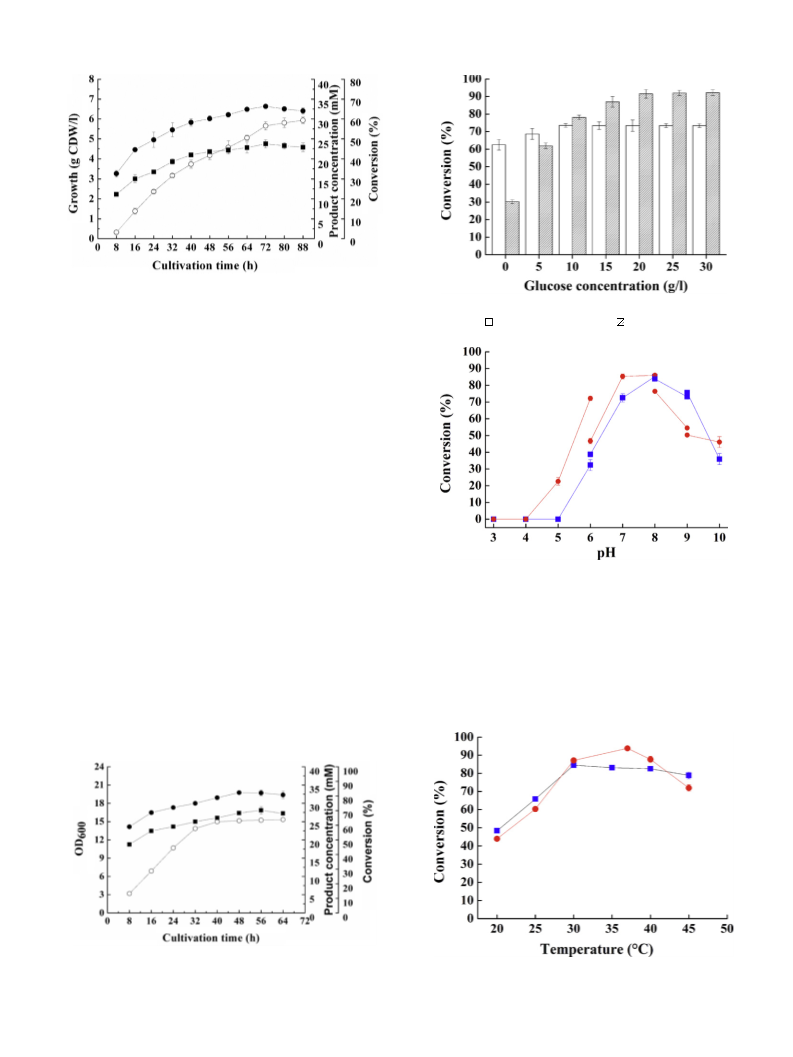
Nocardia sp. WY1202 and R. erythropolis WY1406 were culti-
vated as described above. The cell dry weight (CDW) or the OD
value of the cell culture was measured at an interval of 8 h.
2.2. Isolation of microorganisms
Similarly, two strains were cultured under the same conditions
to different growth periods. The corresponding resting cells were
prepared as described in Section 2.4 and used for determining the
carbonyl reductase activity by measuring the conversion for the
reduction of 3-quinuclidinone. The reduction of 3-quinuclidinone
hydrochloride (6 g/l, 37 mM) in phosphate buffer (100 mM, pH 7.0)
containing 10 g/l of glucose by Nocardia sp. (80 g/l of wet cells)
Soil samples (5 g) were suspended in 50 ml of sterilized water in
a 250 ml Erlenmeyer flask with a number of glass beads to scatter
◦
the soil sample. The flask was shaken at 30 C and 200 rpm for 1 h
and rested for 20 min, and then 5 ml of the supernatant was trans-
ferred into 50 ml of sterilized liquid medium (MSM) in a 250 ml
flask. Different concentrations of 3-quinuclidinone-HCl (1–10 g/l,
◦
6
.2–62 mM) was mixed with the liquid medium. The enrichment
was carried out at 30 C for 12 h under aerobic conditions. Sim-
◦
culture was carried out at 30 C and 200 rpm for 2–5 days, and
then 5 ml of the culture liquid was transferred into a fresh medium
with the same composition for another round of enrichment culture
ilarly, the reduction by R. erythropolis (85 g/l of wet cells) was
carried out in the presence of 15 g/l of glucose for 24 h. The reac-
tion mixture (400 l) was alkalified by addition of an equal volume
(
2–5 days). 0.2 ml of the culture were sprayed onto the MSM agar
of saturated K CO3 and then the resulting mixture was extracted
2
plates with 6 g/l (37 mM) of 3-quinuclidinone-HCl. The plates were
placed on incubator at 30 C and monocolonies were individually
with 800 l of butyl alcohol. The extract was dried over anhydrous
sodium sulfate and analyzed by GC to determine the conversion and
enantioselectivity.
◦
inoculated into RM 1 agar slopes. The pure isolated strains were
inoculated into 20 ml of sterilized RM 1 in a 100 ml flask which
were constantly shaken for 24–48 h, and then 3-quinuclidinone-
HCl (about 6 g/l, 37 mM) was added for transformation. The reaction
2.6. Effects of added glucose, pH and temperature on the
reduction of 3-quinuclidinone by resting cells of Nocardia sp.
WY1202 and R. erythropolis WY1406
◦
mixture was incubated at 30 C, 200 rpm. Samples were withdrawn
after every 12 h up to 96 h and alkalified by the addition of K CO ,
2
3
then extracted with butyl alcohol (1:1, v/v) and analyzed by thin-
layer chromatography (TLC). The samples with an obvious product
spot were further analyzed by GC and HPLC for determination of
conversion and ee.
In the studies on the effect of added glucose, for Nocardia
sp., the reaction mixture containing 60 mg (0.37 mmol) of 3-
quinuclidinone hydrochloride, certain amount of glucose and 0.8 g
of wet cells harvested from 55 ml of the culture broth in 10 ml
◦
of phosphate buffer (100 mM, pH 7.0) was shaken at 30 C and
2.3. Phenotypic, biochemical characterization and 16S rDNA
200 rpm. For R. erythropolis, 0.85 g of wet cells harvested from 25 ml
sequence analysis
of the culture broth was used and the reaction was carried out
in phosphate buffer (100 mM, pH 8.0) at 37 C. The work-up and
◦
Cell morphology of the selected strain was observed via a light
microscope (Olympus CX21, Japan). Conventional physiological
and biochemical characterization tests were carried out using phys-
iological and biochemical kit, as described in Bergey’s Manual of
Determinative Bacteriology.
determination of conversion followed the procedures described in
Section 2.5.
◦
The reduction reactions were also carried out at 30 C and
various pHs using 100 mM buffers (sodium citrate buffer for pH
3.0–6.0, K HPO /KH PO for pH 6.0–8.0, Tris–HCl for pH 8.0–9.0,
2
4
2
4
Total genomic DNA was extracted using TIANamp Bacte-
ria DNA kit (Tiangen Biotech, Beijing, China). The 16S rDNA
was amplified by PCR (96 C for 5 min, one cycle; 94 C
Na CO /NaHCO for pH 9.0–10.0), as described above, to evaluate
2 3 3
the pH effect. 10 g/l and 20 g/l of glucose was used and the mix-
tures were shaken for 16 and 40 h for Nocardia sp. WY1202 and R.
erythropolis WY1406, respectively. To determine the temperature
effect, the reductions were performed under the same conditions
except the pH was kept at 8.0 and the reaction temperature was
◦
◦
◦
◦
◦
for 30 s/52 C for 30 s/72 C for 90 s, 29 cycles; 72 C for
1
0 min, one cycle) using dNTPs mix (0.2 mmol l−1), univer-
sal primers (27F: 5 -AGAGTTTGATCCTGGCTCAG-3 , 1494R: 5 -
GGTTACCTTGTTACGACTT-3 ; 0.5 mol l
template (100 ng) and Taq polymerase (2.5 U) in a final volume of
0 l. PCR products were purified using the TIANgel Midi Purifica-
ꢀ
ꢀ
ꢀ
ꢀ
−1
◦
each), genomic DNA
varied from 20 to 45 C.
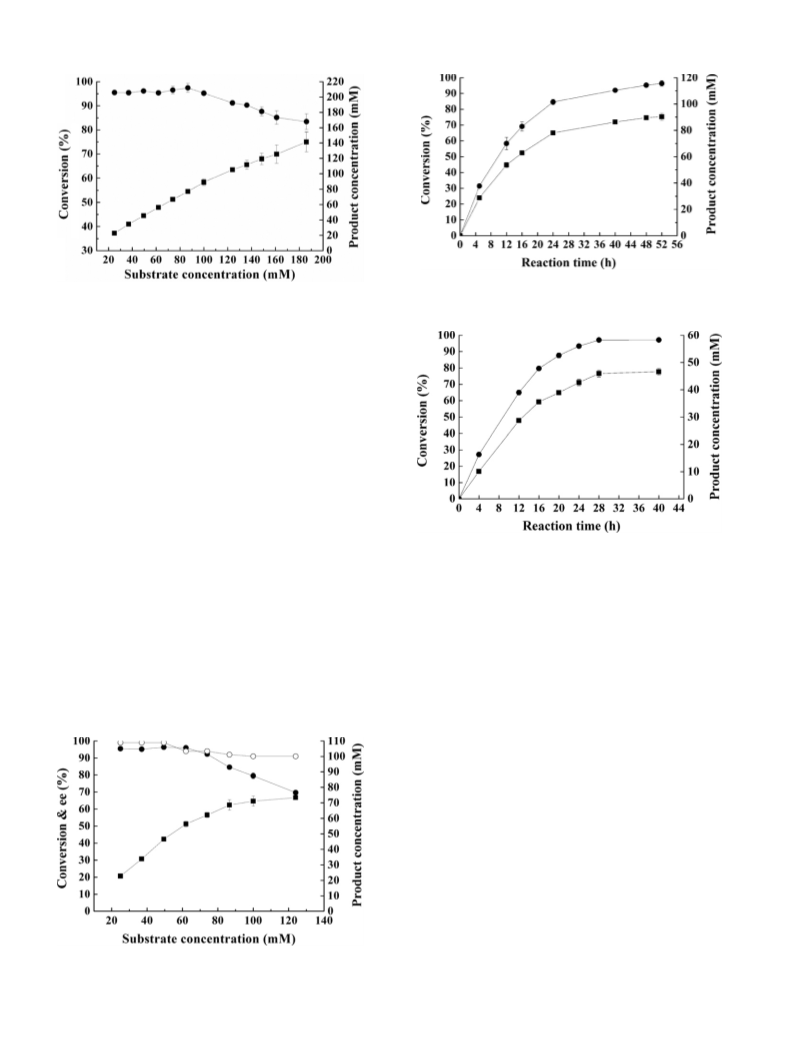
In order to evaluate the effect of substrate concentration on
the reduction of 3-quinuclidinone, for Nocardia sp. WY1202, 0.8 g
of wet cells were added into 10 ml of phosphate buffer solu-
tion (100 mM, pH 8.0) containing 40–300 mg (0.25–1.86 mmol)
5
tion kit (Tiangen Biotech, Beijing, China) and sequenced. The 16S
rDNA sequences were submitted to GenBank on NCBI for BLAST

 Wang, Yu