7
2
M. Jose John et al. / Thermochimica Acta 534 (2012) 71–76
Na C O to Na CO in the temperature range 783–803 K. Mechan-
hand, isoconversional methods do not compute a frequency factor
nor determine reaction models which are needed for a complete
and accurate kinetic analysis. In solid state kinetics, mechanistic
interpretations usually involve identifying a reasonable reaction
model [31] because information about individual reaction steps is
often difficult to obtain. A model can describe a particular reac-
tion type and translate that mathematically into a rate equation.
Many models have been proposed in solid-state kinetics and these
models have been developed based on certain mechanistic assump-
tions. Solid-state kinetic reactions can be mechanistically classified
as nucleation, geometrical contraction, diffusion and reaction order
models [10]. The TG data were subjected to weighted least squares
analysis by all kinetic models given in [10].
2
2
4
2
3
ical addition of foreign substances into inorganic salts is known to
give rise to two different types of effects on the thermal behavior
of salts: (i) by the formation of a stable compound between the salt
and the additive [20] and (ii) by a catalytic action of the additive
[
21–24]. Algird [9,25] observed that electron donors when present
along with Ag C O accelerates the thermal decomposition rate
2
2
4
and electron acceptors retards.
CuO is a black solid having molar mass of 79.545 with an ionic
structure. It melts above 1474 K with some loss of oxygen. CuO
has application as a p-type semiconductor, because it has a narrow
band gap of 1.2 eV [26]. The effectiveness of the reagent depends on
the method of preparation, a problem that is typical for other het-
erogeneous reagents where surface area, among other variables, is
significant [27]. TiO is a white solid having a molar mass of 79.870.
2
3
. Results and discussion
It melts at 2143 K and boils at 3245 K. Titanium dioxide is the most
widely used white pigment because of its brightness and very high
refractive index (ꢀ = 2.4). It is also used as a semi-conductor [28].
The effects of semiconducting oxides such as CuO and TiO2 on
the thermal decomposition kinetics of Na C O were examined
2
2
4
using mechanical mixtures of compositions 0.5, 1, 2, 5 and 10 wt%
of the oxide. The experimental mass loss data obtained from TG
were transformed into ˛ versus t data as reported earlier [32], in
the range ˛ = 0.05–0.95 with an interval of 0.05, at all tempera-
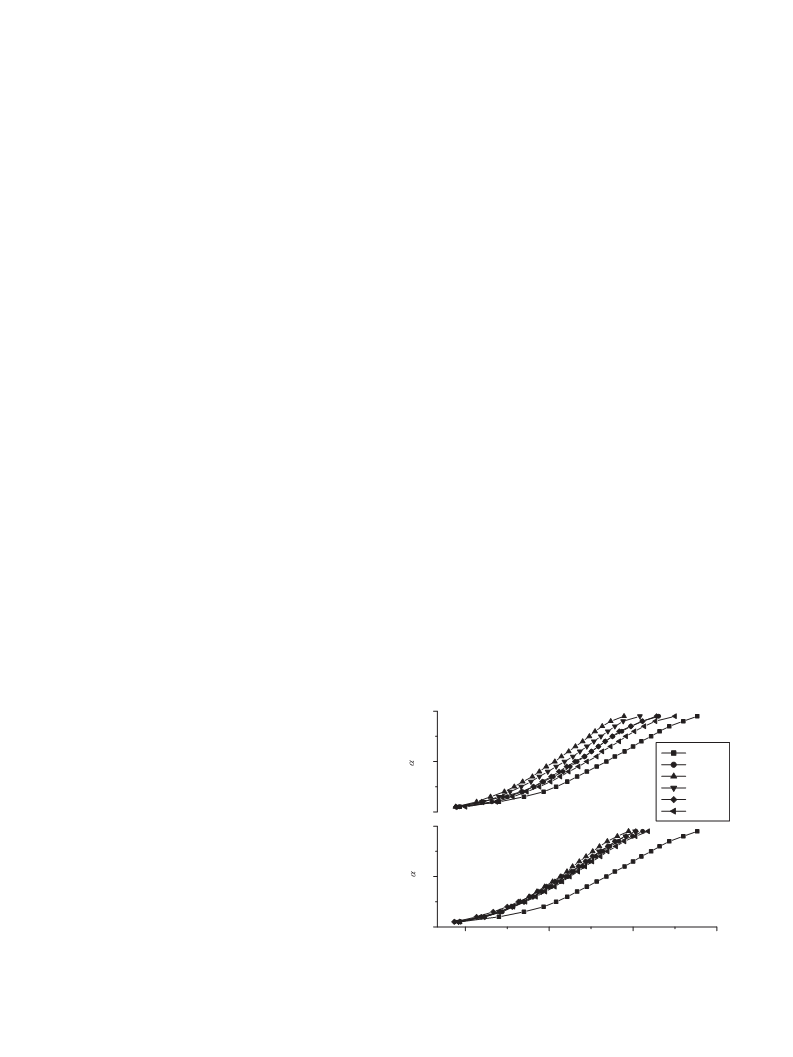
tures studied. The ˛ versus t curves for the thermal decomposition
of all oxide mixed samples are shown in Figs. 1 and 2. The effect
2
. Experimental
2.1. Materials
All the chemicals used in the present study were of AnalaR grade
samples of E Merck. Mechanical mixtures of sodium oxalate and
metal oxides, CuO and TiO , were prepared by mixing the oxalate
and oxide of same particle size, viz., 106–125 m. Different samples
with oxide concentrations 0.5, 1, 2, 5 and 10 wt% were prepared by
mixing 2 g sodium oxalate thoroughly, in an agate motar, with the
required quantity of the oxide.
of pre-compressed oxide (CuO and TiO ) additives on the ther-
2
2
mal decomposition of Na C O was also examined at 783 K; the
2
2
4
˛
versus t plots is shown in Fig. 3.
Weighted least squares analysis of the thermal decompo-
sition of oxide mixed samples of Na C O showed that, as
2
2
4
with untreated sodium oxalate [11], there are two stages in
the decomposition; an acceleratory stage up to ˛ = 0.5 fol-
lowed by the decay stage, which are respectively described by
the Prout–Tompkins {ln[˛/(1 − ˛)] = kt} and contracting cylinder
Pre-compressed oxides (CuO and TiO ) were prepared by sub-
2
jecting to compression to 0.5 g each of CuO and TiO2 of particle
3
size 106–125 m in a hydraulic press at pressures of 2 × 10 ,
3
3
−2
4
× 10 and 6 × 10 kg cm . The pellets of metal oxides were taken
1/2
model [1 − (1 − ˛) = kt] rate laws with separate rate constants,
out, powdered in an agate mortar and fixed the particle size in
the range 106–125 m. Required quantity of the pre-compressed
oxide was thoroughly mixed with sodium oxalate (particle size:
k
1
and k . The rate constants obtained for both stages of thermal
2
decomposition are shown in Table 1. Both oxides cause an increase
in the rates of both stages of decomposition up to an oxide concen-
tration of 1 wt% and then decreases (see Fig. 4 and Table 1). The
effect of mixing pre-compressed oxides on the thermal decom-
position of Na C O was also examined at 783 K (Table 2). The
1
2
2
06–125 m), in an agate mortar, to get 1 wt% mixture.
.2. Methods
2
2
4
dependence of the rate constant of both acceleratory and decay
stages of the thermal decomposition of pre-compressed oxide
mixed sodium oxalate on the concentration of pre-compressed
.2.1. Thermogravimetric analysis
Thermogravimetric measurements in static air were carried out
on a custom-made thermobalance fabricated in this laboratory
15,29]. A major problem [30] of the isothermal experiment is that
[
a sample requires some time to reach the experimental temper-
ature. During this period of non-isothermal heating, the sample
undergoes some transformations that are likely to affect the suc-
ceeding kinetics. The situation is especially aggravated by the fact
that under isothermal conditions, a typical solid-state process has
its maximum reaction rate at the beginning of the transformation.
So we fabricated a thermobalance particularly for isothermal stud-
ies, in which loading of the sample is possible at any time after
the furnace has attained the desired reaction temperature. The
operational characteristics of the thermobalance are, balance sen-
1
0
.0
.5
CuO
0
wt %
0.5 wt %
1 wt %
2
5
wt %
wt %
0
1
.0
.0
10 wt %
TiO2
−5
sitivity: ± 1 × 10 g, temperature accuracy: ± 0.5 K, sample mass:
−
2
5
× 10 g, atmosphere: static air and crucible: platinum. Thermal
decomposition of sodium oxalate was found to be very slow below
83 K and very fast above 803 K. The decomposition was thus stud-
0.5
7
ied in the range 783–803 K. The loss in mass of sodium oxalate was
measured as a function of time (t) at five different temperatures (T),
viz., 783, 788, 793, 798 and 803 K.
0
.0
1
5
30
45
60
t / min
2.2.2. Kinetic analysis
Historically model-fitting methods were widely used because of
Fig. 1. ˛ versus t plots for the thermal decomposition of oxide mixed sodium oxalate
their ability to directly determine the kinetic triplet. On the other
samples at different concentrations at 783 K.

 Jose John