L. Wang et al. / Catalysis Communications 12 (2011) 1458–1462
1459
Y(NO3)3·6H2O, Pr2O3, Nd2O3, Sm2O3, Eu2O3 were purchased from
Sinopharm Chemical Reagent Co., Ltd.
suggesting that the calcination temperature has a great influence on
the texture of lanthanum oxide. The texture of La2O3-com was also
measured, and similar results as that of La2O3-600 were obtained.
2.2. Catalyst preparation
3.1.2. Structural characterization studies
In a typical procedure, lanthanum oxide was prepared by precipi-
tation method. 1 M Na2CO3 aqueous solution was added dropwise to an
aqueous solution containing 0.5 mol/L lanthanum nitrate until
pH=10–11. The resulting La(OH)3 precipitate was filtrated, washed
with distilled water, dried, and calcined at 600 °C. The obtained white
powdery solid was denoted as La2O3-600. The abbreviations represent
as follows: La2O3-com (commercially obtained), La2O3-decom (thermal
decomposition of lanthanum nitrate). Other rare earth oxides, were also
prepared by similar precipitation method aforementioned, except for
the Pr2O3, Nd2O3, Sm2O3, Eu2O3 were firstly dissolved in diluted nitric
acid to obtain the corresponding precursors of nitrate.
XRD patterns of various lanthanum oxides are shown in Fig. 1. The
La2O3-600 sample exhibited two distinct crystalline phases, hexago-
nal phase of La2O2CO3 (JCPDS 84-1963) and La2O3 (JCPDS 24-0554),
and the former was the dominant phase. The La2O3-decom and La2O3-
800 exhibited similar crystalline phases as compared to La2O3-600,
though the relative intensities of diffraction lines related to La2O2CO3
were obviously lower. Whereas, for the La2O3-com, only the
diffraction lines related to hexagonal structure of La2O3 crystalline
phase was observed. Poor crystalline phase of orthorhombic structure
of La2(CO3)3(H2O)8 was observed for La(OH)3 precipitate and La2O3-
400. The XRD patterns of the catalyst reused for six times basically
matched with that of fresh one, though the peak at lower 2θ was
slightly less intense.
2.3. Catalyst characterization
N2 adsorption and desorption isotherms at 77 K were measured on
a Micromeritics ASAP 2010 surface analyzer.
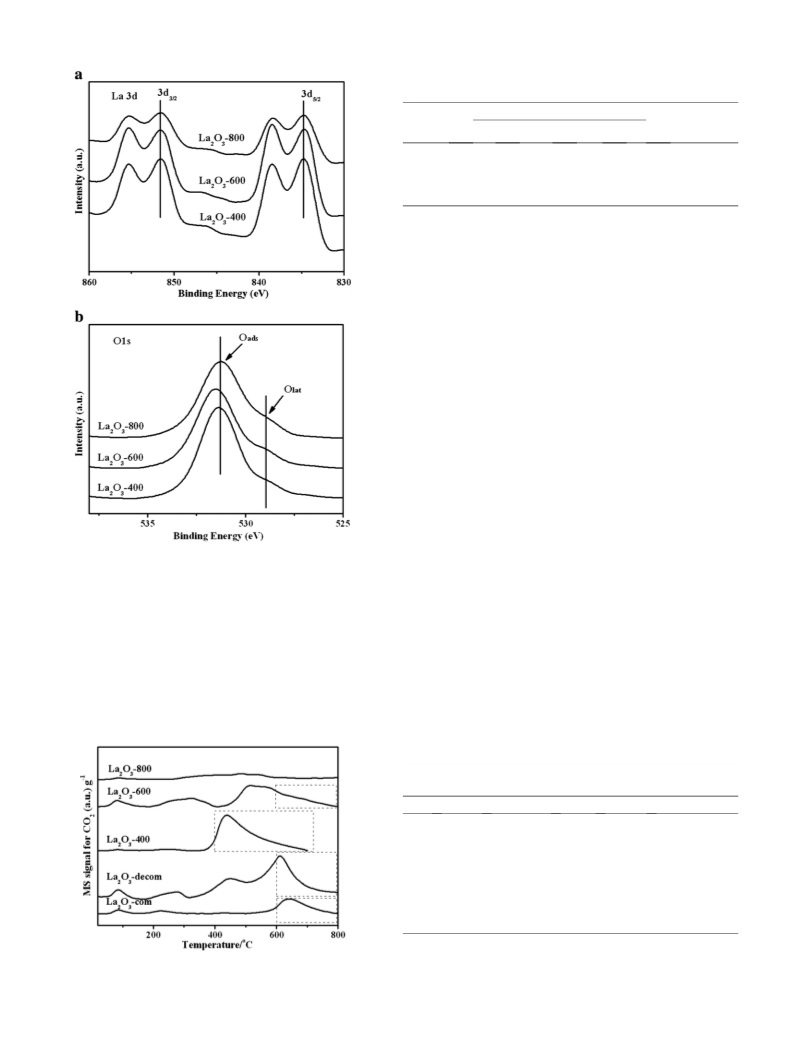
3.1.3. Surface compositions analyzed by XPS
The influence of the calcination temperature on the chemical
states of La2O3 has also been investigated by means of XPS, as shown
in Fig. 2a. The binding energy (BE) of La3d5/2 varied slightly around
833.5 0.2 eV. Two distinct oxygen species for O1s can be well
resolved. The BE around 528.7 eV was attributed to oxygen ions in the
crystal lattice (Olat), while the line located at 531.2 eV can be ascribed
to the adsorbed oxygen (Oads). Actually, the position of O1s BE value
was considered to be correlated to the surface basicity [14,15]. The Olat
with higher electron density was considered to act as Lewis base site
and shows stronger basicity than the Oads species.
X-ray diffraction (XRD) was measured on a Siemens D/max-RB
powder X-ray diffract meter. Diffraction patterns were recorded with
Cu Kα radiation (40 mA, 40 kV) over a 2θ range of 10° to 80°.
X-ray photoelectron spectroscopy (XPS) analysis was performed
with a VG ESCALAB210 instrument. Mg Kα radiation at an energy
scale calibrated versus adventitious C1s peak at 285.00 eV was used.
Fourier transform infrared spectroscopy (FT-IR) transmission data
were collected for pressed catalyst disk made with KBr in the range of
4000–400 cm−1 with a Nicolet 5700 FT-IR.
The surface acid-base properties of the catalysts were measured by
temperature programmed desorption of CO2 and carried out on TPD
flow system equipped with an MS detector (DM300, AMETEK, USA).
The quantitative analysis for CO2 desorption is calculated based on the
integration of the corresponding TPD traces.
3.1.4. Basicity characterized by CO2 TPD
Fig. 3 shows the CO2 TPD profiles over various lanthanum oxides.
According to carbon dioxide desorption temperature (Td), weak
(b200 °C), medium (200–400 °C), strong (N400 °C) basic sites can be
roughly classified, as shown in Table 2. In all the samples, the amounts
of weak basic sites are b8 μmol CO2 g−1. La2O3-com exhibited small
basic sites (4 and 33 μmol CO2 g−1, respectively) in the region of
medium and strong strength. By contrast, the trace for La2O3-decom
consists of four desorption peaks, especially dominant in the region of
medium and strong strength. Accordingly, the basic sites with weak
strength mostly correspond to OH− groups on the catalyst surface,
while those with medium and strong strength are related to the
oxygen of Mn+–O2− ion pairs and isolated O2− anions, which are
generally considered as Lewis basic sites for metal oxides [16]. In
particular, the contribution of strong basicity for La2O3-600 reaches
2.4. Catalytic testing
In a typical catalytic test, 6 g urea (100 mmol), 18.4 g (200 mmol)
glycerol and 0.06 g La2O3-600 catalyst was added to a round-bottom
flask (50 ml) equipped with a condenser. The reaction was conducted
at 140 °C under pressure of ca. 3 KPa. After the reaction was
completed, the product mixture was diluted by ethanol due to its
relative high viscosity. The quantitative analysis of the product was
determined by Agilent 6820 GC (FTD detector) using 1, 4-dioxane as
internal standard. Qualitative analysis was conducted on a HP
6890/5973 GC-MS with a capillary column.
3. Results and discussion
3.1. Catalyst characterization
3.1.1. Characterizations of N2 adsorption
The textural properties of the lanthanum oxides are given in
Table 1. The BET surface area increased monotonically from 2.3 to
8.0 m2g−1 with the calcination temperature elevated from 400 to
800 °C. In parallel, the pore diameter decreased from 56.9 to 16.1 nm,
Table 1
Textural properties of various lanthanum oxides.
Sample
Pore volume (cm3/g)
BET area (m2/g)
Pore diameter (nm)
La2O3-400
La2O3-600
La2O3-800
La2O3-com
0.033
0.021
0.032
0.027
2.3
5.0
8.0
5.5
56.9
21.7
16.1
19.8
Fig. 1. Powder XRD patterns of lanthanum oxide catalysts. (▼) Features corresponding
to hexagonal La2O2CO3 phase. (★) Features corresponding to hexagonal La2O3 phase.

 Wang, Liguo