CHEMSUSCHEM
FULL PAPERS
fading) that is about four times higher relative to that of con-
ventional LICs (see the Supporting Information, Figure S10). On
the basis of the above electrochemical results, we emphasize
that the proposed strategy of integrating LFO into the PE as
with a 3D pixel semiconductor detector and CuK
radiation (l=
a
1
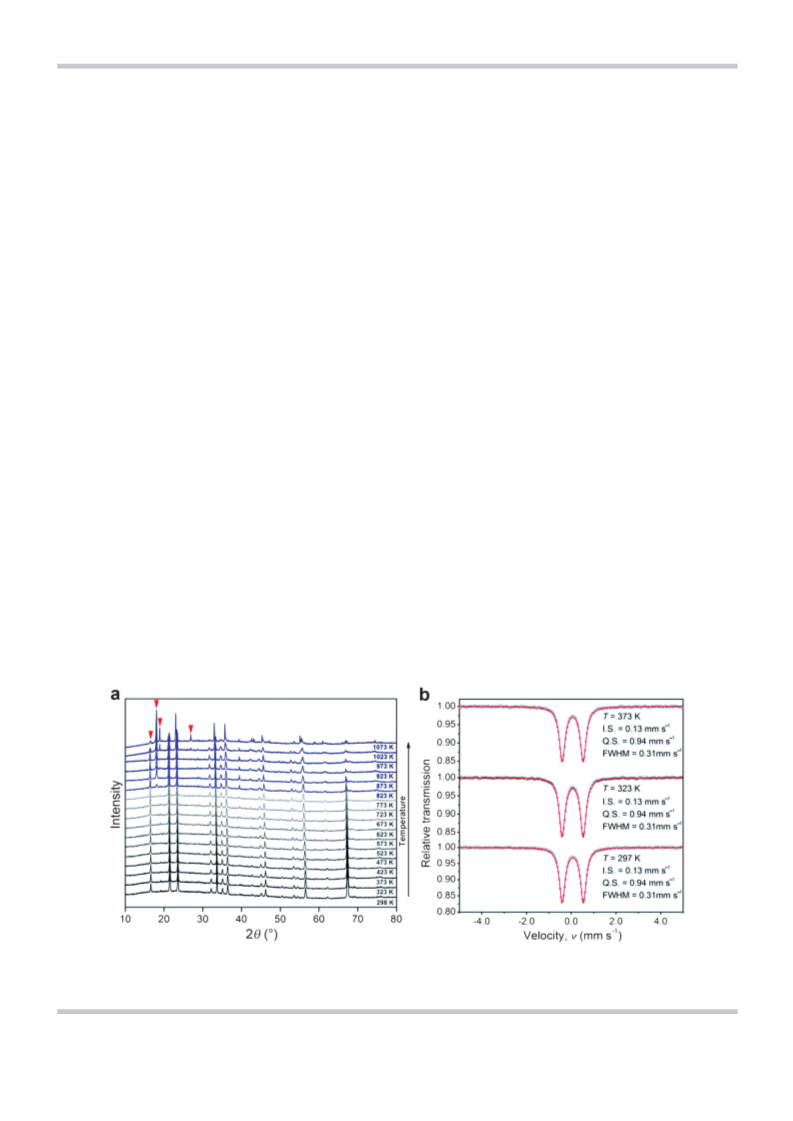
.54056 ꢁ). In situ high-temperature XRD analyses were carried out
with a scan step of 50 K under an air atmosphere. To collect in situ
diffraction data, the cell was charged and discharged at a constant
current density of 0.05 C in the voltage range of 2.5 to 4.7 V (vs. Li/
+
a novel Li predoping method would be favorable not only
+
Li ). Field emission scanning electron microscopy (FESEM, JEOL
+
for ensuring effective and controllable Li doping, good long-
JSM-7000F) and high resolution transmission electron microscopy
term cyclic performance, and enhanced volumetric energy
density, but also for securing safety in fabrication and opera-
tion of LICs.
(
HRTEM, JEOL JEM3010) were employed to examine the morpholo-
gy and microstructure of the final product. In addition, the chemi-
cal state and composition of the final product were identified by
X-ray photoelectron spectroscopy (XPS, Thermo Scientific Sigma
probe) and inductively coupled plasma mass spectroscopy (ICP-MS,
Bruker aurora M90), respectively.
Conclusions
Electrochemical measurements: The PE electrodes, composed of
activated carbon and LFO, were prepared by coating a slurry con-
taining the active materials (activated carbon+LFO, 92 wt%) and
polyvinylidene difluoride (PVDF) as binder (8 wt%), dissolved in N-
methyl-2-pyrolidinone (NMP), on Al mesh. The NE was prepared by
coating a slurry containing the active material (hard carbon,
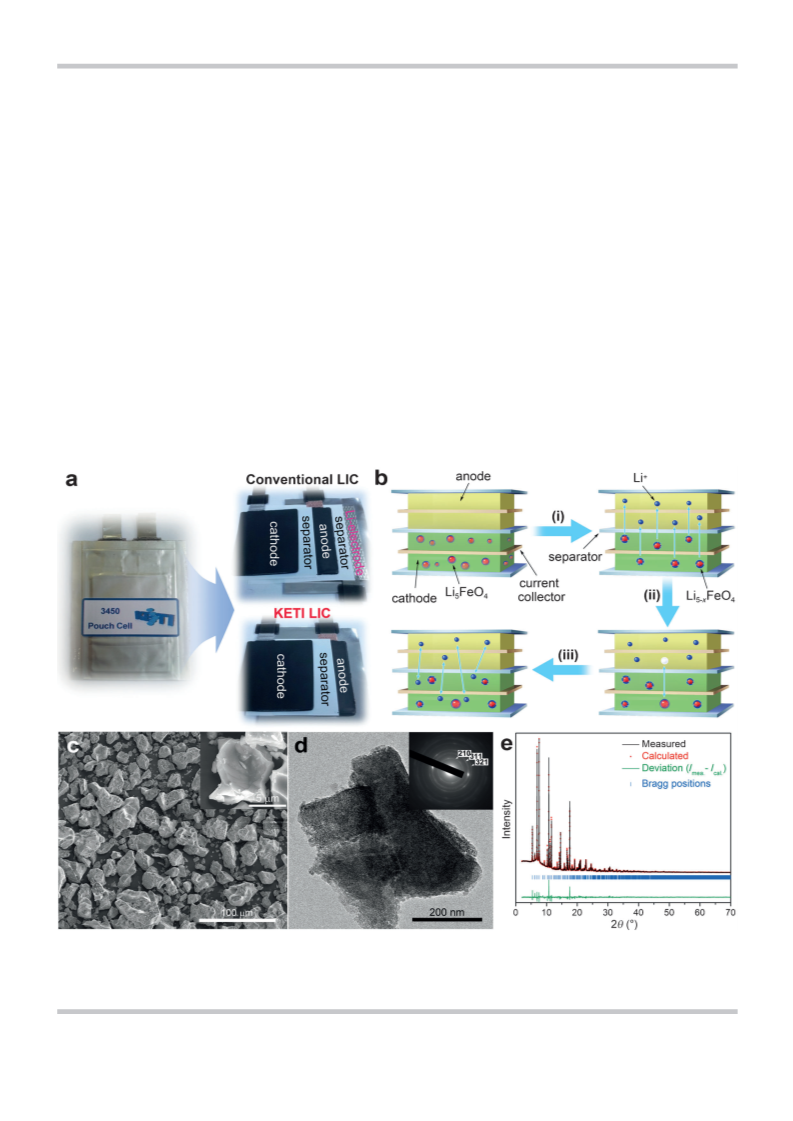
We rationally designed a lithium-ion hybrid capacitor (LIC) full
cell by integrating single-phase Li FeO (LFO) into the positive
5
4
+
electrode (PE), without the use of metallic lithium for Li pre-
doping, and thoroughly investigated its structural and electro-
chemical properties to explore the possibilities and limitations
of LFO as an alternative lithium source for robust and high-per-
8
0 wt%), conducting agent (super-P, 10 wt%), and binder (PVDF,
+
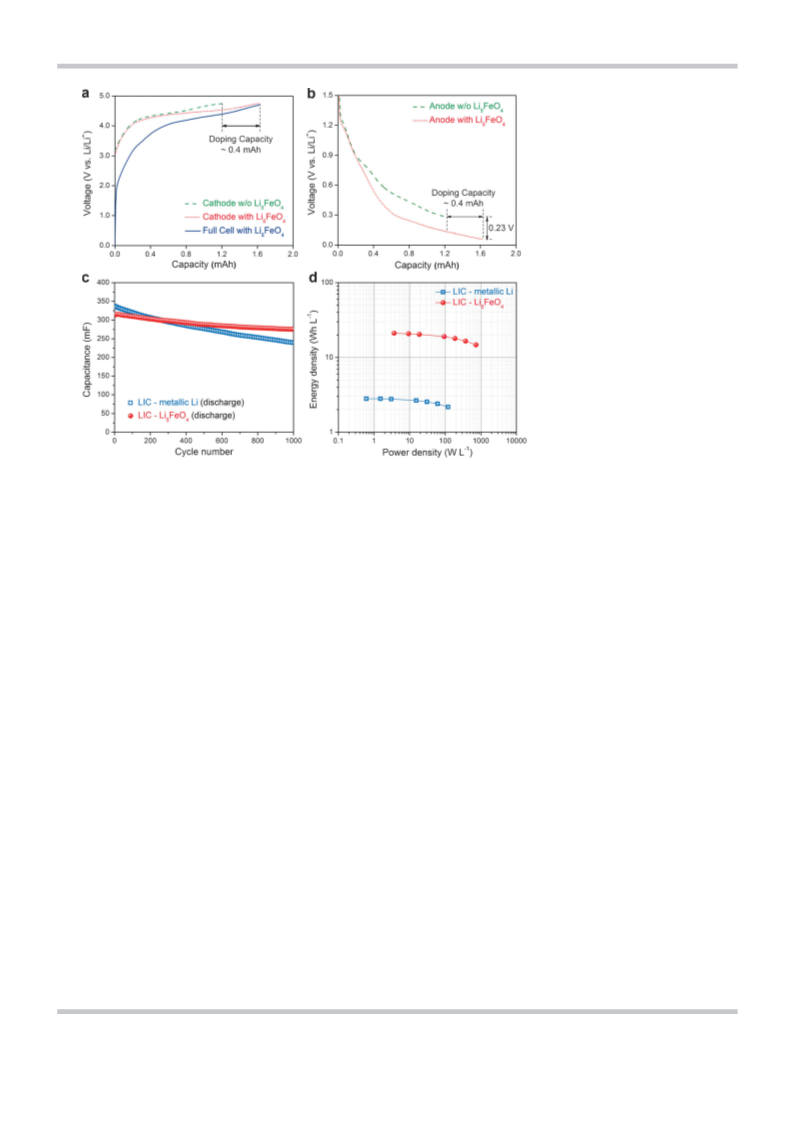
formance LICs. The highly irreversibility extraction of Li from
10 wt%) on Cu mesh. In the PE, the loading amount of LFO
(10.3 wt%) was calculated based on the corresponding NE capacity
(0.404 mAh; 60% doping level) and the specific capacity of LFO
À1
LFO, having a high capacity of ~700 mAhg , is suitable for
+
providing sufficient Li amounts for the NE prior to cell opera-
À1
+
(
673 mAhg ) when it is charged up to 4.7 V (vs. Li/Li ). The frac-
tion, and the doping level can be controlled in a scalable
manner. By eliminating the auxiliary metallic lithium electrode
and incorporating LFO into the PE in the cell, we achieved not
tions of active (activated carbon) and additive (LFO) mass were de-
signed to amount to 81.7 and 10.3 wt%, respectively. The loading
À1
level and density of the PE were fixed at 6.1 mgcm
0
and
+
only efficient Li predoping but also higher energy density
À3
.5 gcm . To evaluate electrochemical properties, beaker-type half
and better safety of the LIC. Further optimizations, such as re-
ducing the particle size of LFO and ensuring sufficient electrical
conduction, would enhance the electrochemical performance
of LICs and thereby assure the viability of the proposed facile
but innovative approach.
cells and full cells were carefully assembled in a dry room. The PE
and NE were punched into disks 112 and 114 mm in size, re-
spectively, and electrolyte (8 mL) was added into each cell. A
porous polyethylene membrane was used as the separator, and
LiPF6 (1.3m) dissolved in ethylene carbonate/dimethyl carbonate
+
(
3:7 v/v, PANAX ETEC Co. Ltd) was used as the electrolyte. For Li
+
predoping, the cells were charged to 4.7 V (vs. Li/Li ) and dis-
charged to 2.5 V (vs. Li/Li ) with a constant current rate of 0.1 C.
+
Experimental Section
After that, the cells were further cycled in a voltage range of 1.5 to
3.9 V at different current densities.
Sample preparation: Single-phase LFO was prepared by a solid-
state reaction using lithium oxide (Li O, >97%, Aldrich) and iron
2
(
III) oxide (Fe O , >99%, Aldrich) as starting materials. Stoichiomet-
2 3
ric amounts of the starting materials were thoroughly mixed with
a molar ratio of 5:1 and then physically ground. After grinding, the
powder was pelletized and finally sintered at 9008C under an Ar
atmosphere for 48 h. The final product was a white-colored
powder, which easily changed from white to orange when it was
exposed to moisture. Therefore, the powder required careful han-
dling in a dry room to prevent contact with moisture.
Acknowledgements
This research was supported by the Converging Research Center
Program through the Ministry of Science, ICT and Future Plan-
ning, Korea (2013K000290). This work was also partially support-
ed by the IT R&D program of MOTIE/KEIT [10046306, Develop-
À1
Structural characterizations: The structural analysis of LFO was di-
rectly confirmed by high-energy synchrotron radiation (SR) powder
diffraction using a large Debye–Scherrer camera equipped with an
imaging plate as a highly sensitive X-ray detector, at an experimen-
tal hutch of SPring-8, Japan. Magnetization (M–H) was estimated
using a magnetic properties measurement system (MPMS). For this
purpose, LFO powder (0.05431 g) was packed into a small capsule
ment of Li-rich Cathode (ꢁ240 mAhg ) and Carbon-free Anode
À1
Materials (ꢁ1000 mAhg ) for High Capacity/High Rate Lithium
Secondary Batteries].
Keywords: capacitors · doping · electrochemistry · electrodes ·
lithium
(
0.13666 g) and was measured at 300 K. Isothermal magnetization
was recorded by collecting a hysteresis loop between 50 and
[
[
[
À50 kOe. Mçssbauer measurements were performed up to 373 K.
5
7
A g-ray source of Co in a Rh matrix of 925 MBq was used. The ve-
locity scale of the spectra was relative to that of a-Fe at room tem-
perature. The measurements of the source and the sample were
conducted under the same temperature and pressure conditions
À3
(
Pꢀ10 Pa). The structure of the final product was defined using
an X-ray diffractometer (XRD, EMPYREAN, PAN analytical) equipped
ꢀ
2014 Wiley-VCH Verlag GmbH & Co. KGaA, Weinheim
ChemSusChem 2014, 7, 3138 – 3144 3143

 Park, Min-Sik